
Top 13 Customer Experience KPIs and Metrics in 2025

By Uttam Kumar Dash
October 20, 2023
Last Modified: June 11, 2026


Ever sensed a subtle gap between your brand and the customer loyalty you crave? The key is to utilize Key Performance Indicators (KPIs) to create an unforgettable customer experience (CX).
To begin with, just ask yourself:
Do our customers advocate for our brand for its shared values? Or, what’s preventing them from becoming loyal customers?
The answer you’ll probably get from experts is,

“It’s not just selling products; it’s creating lasting stories at every interaction.”
MD. Kamrul Islam
Head of Support, WP Manage Ninja
While profit margins have their place, they don’t tell the detailed story of your customer’s journey. This is why most small businesses fail to get loyal, repeat customers. They overlook the overall customer experience.
For businesses, recognizing that customers aren’t just making purchases is important. Customers are also undergoing certain experiences. So, if you can meet or exceed their expectations, you can significantly increase your chances of gaining loyal and repeat customers.
From where shall we begin then?
We’d suggest you start by closely monitoring key CX metrics that will help you to smoothen the customer journey.
13 Customer Experience KPIs (CX metrics)
Customer experience KPIs measure customers’ satisfaction level during purchases or product use. It helps businesses to track and enhance the overall customer experience.
To offer a seamless customer experience, simplify the process by breaking down the overall experiences of customers into bite-sized insights. Tailor these insights to your company’s goals and various points in the customer journey.
This approach enables a focused strategy, helping pinpoint the KPIs that genuinely measure your performance.
Here, we will briefly discuss 13 customer experience metrics. These metrics will directly measure customer satisfaction, loyalty, and factors influencing customer experience and your business performance.
1. Customer Satisfaction Score (CSAT)

“Unless you have 100% customer satisfaction, you must improve.”
Horst Schulze,
Founder, Ritz-Carlton
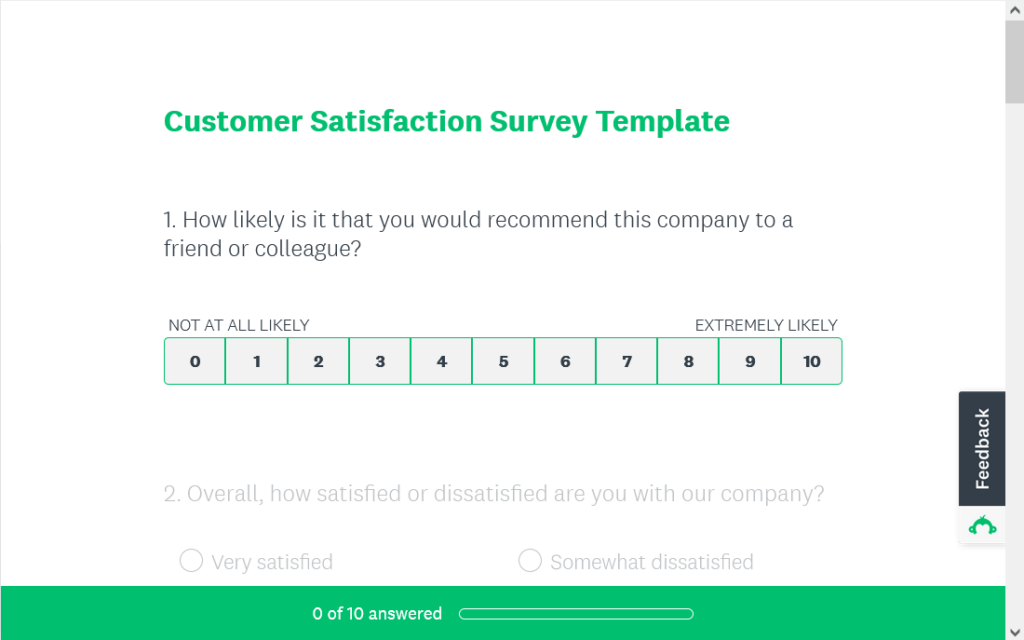
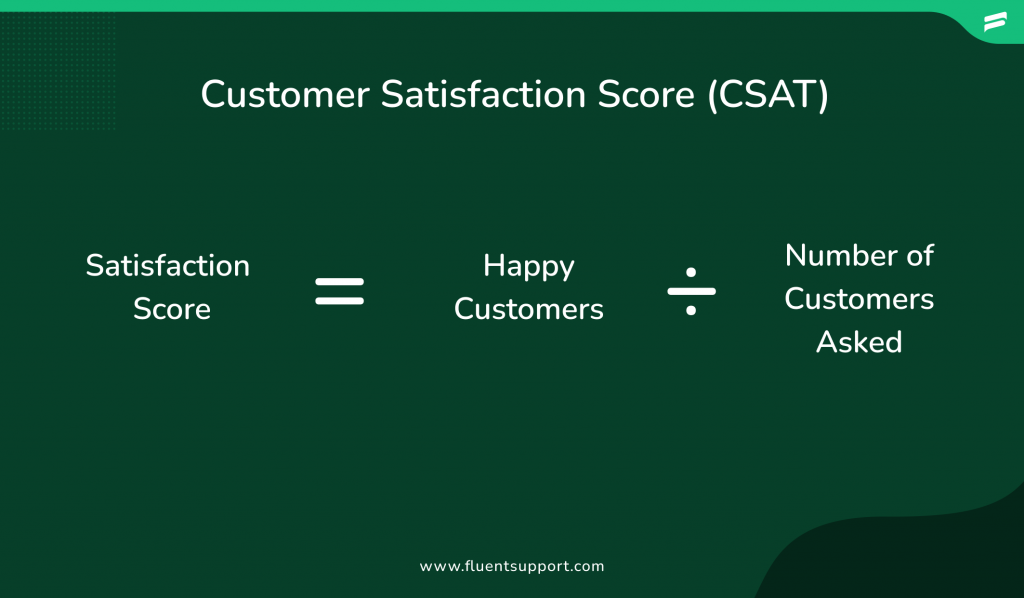
Customer Satisfaction Score or CSAT – A KPI calculating how satisfied your customers are with your company’s product or services. It gets calculated through survey reports. Reports where customers express their feelings about specific aspects of your offerings.
An example might look like this:
When that score is high, it signals that you are meeting or exceeding customer expectations. It means that your business is reducing customer churn rates, and fostering loyalty.
And, this is how you can calculate CSAT:
2. Net Promoter Score (NPS)
Net Promoter Score (NPS) – A metric that shows the likelihood of customers recommending a company’s product or service. It is the gold standard Customer Experience metrics. Through NPS surveys, customers rate on a scale of 1 to 10.
Scores of 9 or 10 signify loyal advocates. 7 or 8 are passives. 6 or below are detractors. A rate 6 or below is risky for businesses. Because it shows that the customers will likely spread negative emotions for your brand through word-of-mouth.
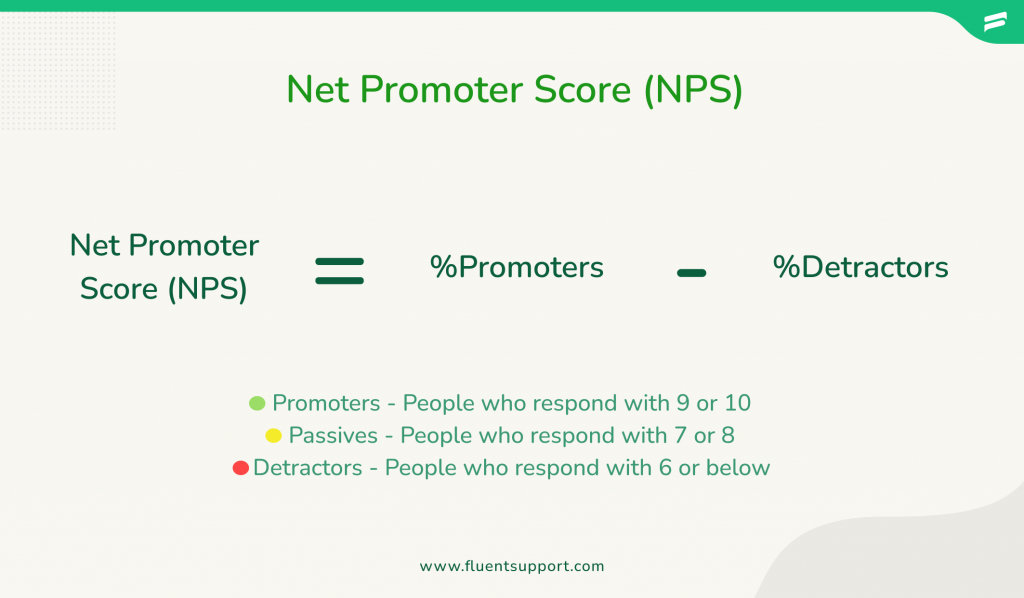
NPS is the difference between promoters and detractors. A high NPS indicates strong customer advocacy. In NPS surveys, a common question is asked to customers, “How likely are you to recommend this business?”
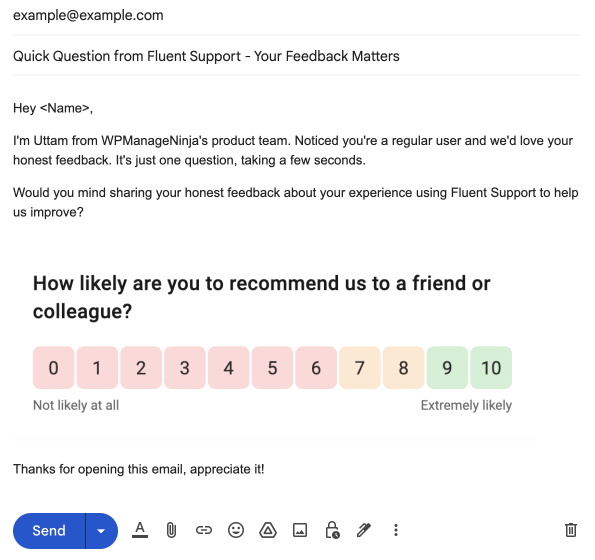
Email survey example with NPS:
NPS online calculator
NPS Calculator in Excel Sheet
Get your hands on our simple NPS Calculator, available for free download in an Excel Sheet format!
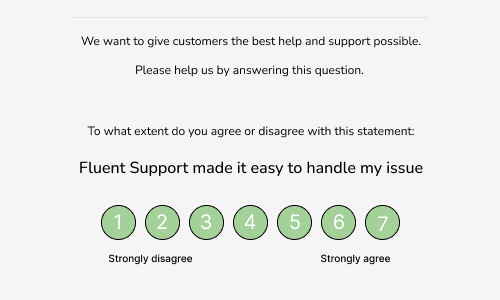
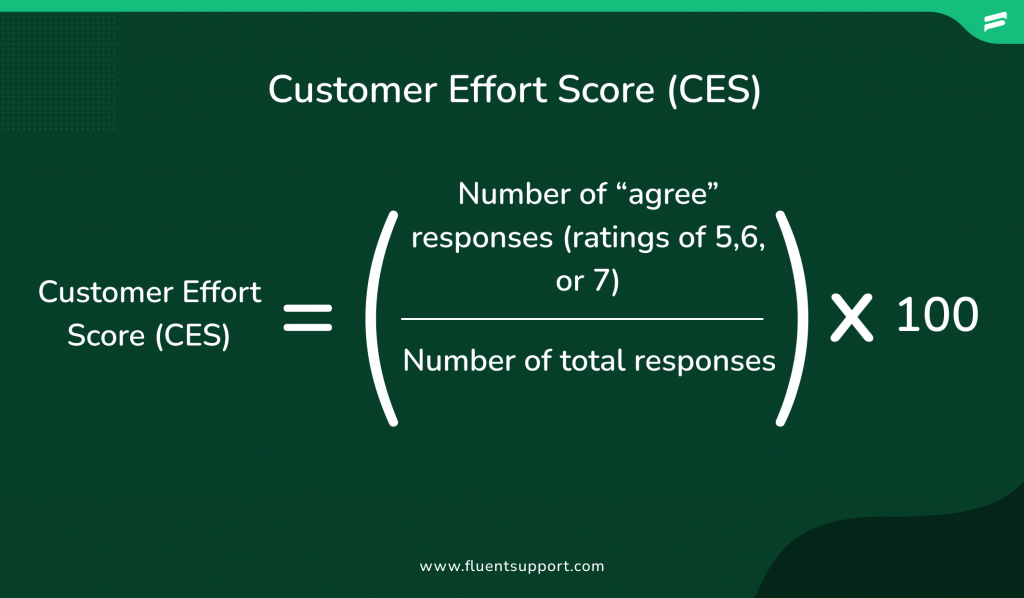
3. Customer Effort Score (CES)
Customer Effort Score (CES) offers insights into the effort customers invest in their interactions with your business. Derived from surveys using a numeric rating scale (1 to 7), CES highlights the ease of the customer experience. A robust CES predicts future customer loyalty.
CES example:
The final CES score is calculated as the percentage of customers. Customers who rated positively (5 or greater) out of the total survey responses, multiplied by 100.
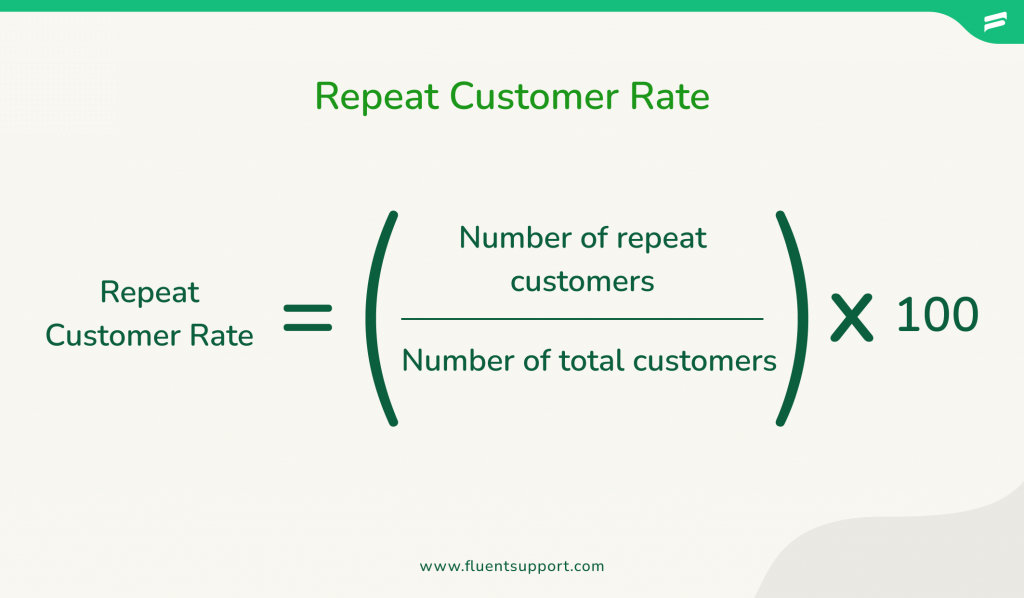
4. Repeat Customer Rate
“Profit in business comes from Repeat customers, Customer that boast about your project and service, and that bring friends with them” – W. Edward Deming
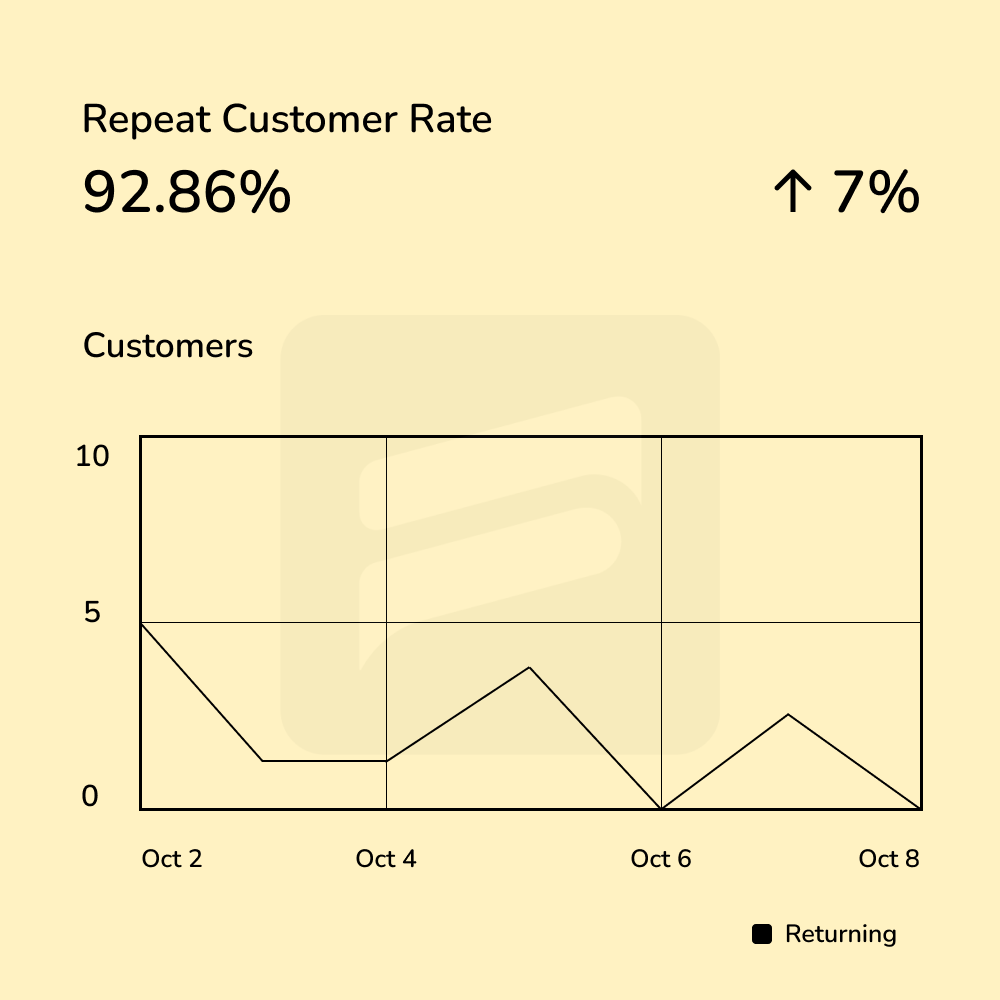
Repeat Customer Rate – shows the percentage of customers who make more than one purchase over a specific period.
Divide the no. of repeat customers by the total no. of customers. Lastly, multiply that by 100. While it might fluctuate a bit during campaigns, it serves as a subtle satisfaction indicator.
Almost half of the revenue for online stores comes from these repeat customers. So, it is clearly more than just a figure.
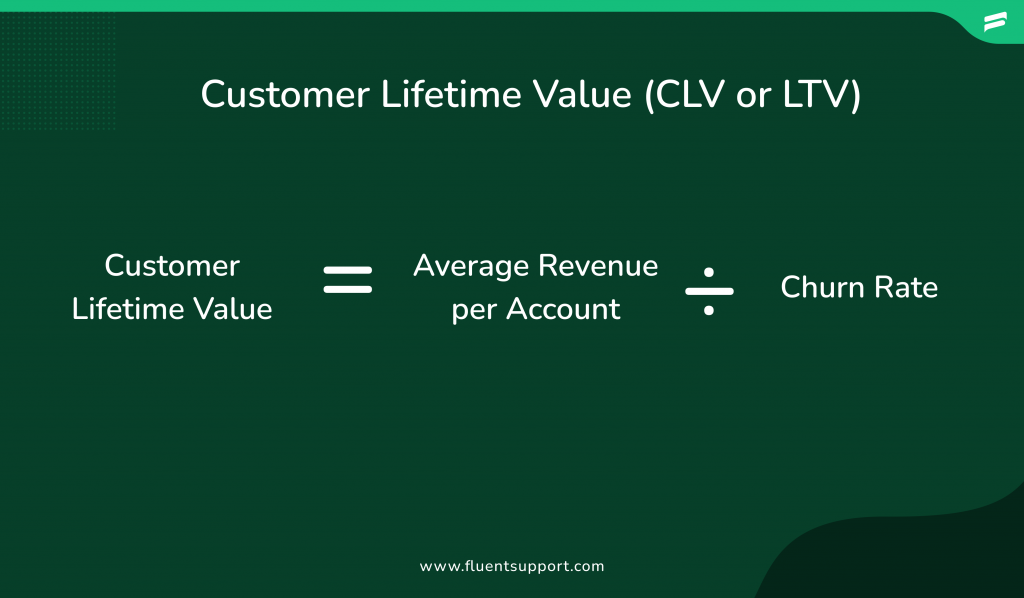
5. Customer Lifetime Value (CLV or LTV)
It can cost four to five times more to acquire new customers versus retaining current ones.
Customer Retention Versus Customer Acquisition, Saravana Kumar, Former Forbes Councils Member
Customer Lifetime Value (CLV or LTV) shows on average, how much money, you can expect from a customer during your business relationship. It goes beyond just transactions, giving a broader view of customer financial value.
You can calculate CLV by dividing the average revenue per account by your churn rate. It is a pivotal SaaS metric wired to customer retention. Your customer support and success teams play a crucial role in boosting this metric. As the customer journey lengthens, so does their lifetime value.
6. Customer Health Score (CHS)
Customer Health Score (CHS) shows success and failure trends, identifying happy users and unhappy users. So, it allows you to expand your opportunities.
To calculate a customer health score you need to measure actions and assign scores. A customer’s health score places them on a retention scale – healthy customers stay, and unhealthy ones may churn.
This system empowers businesses to proactively address concerns. Thus, it results in retaining customer loyalty and leverages high scorers as promoters.
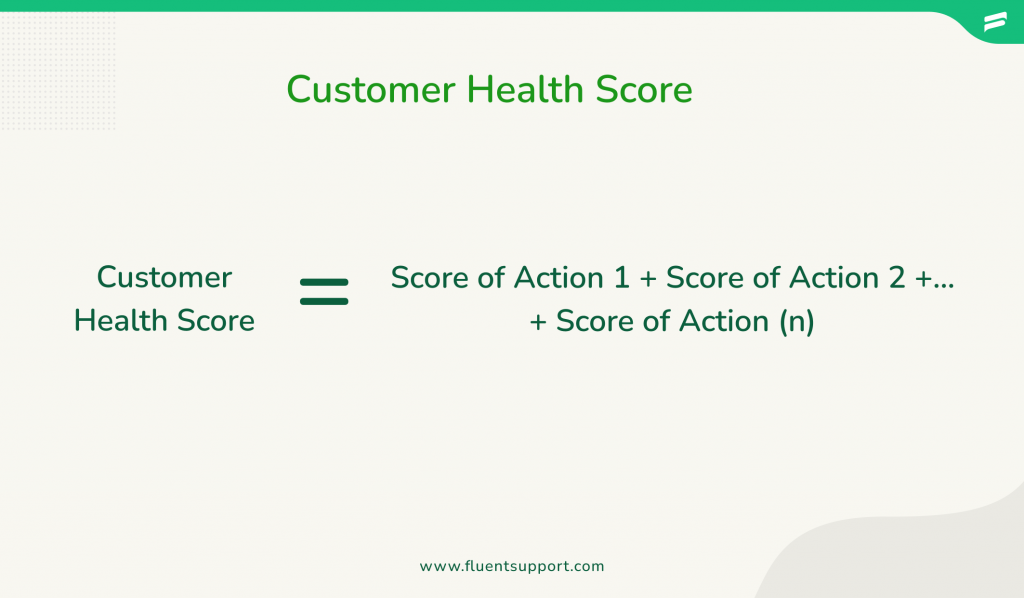
Note: There are also other variations of Customer Health Score equations.
7. Conversion rate (CR)
The best websites have conversion rates of 11% or more.
37+ Conversion Rate Optimization Statistics For 2023: Usage, Facts, & Trends by Matt Moran
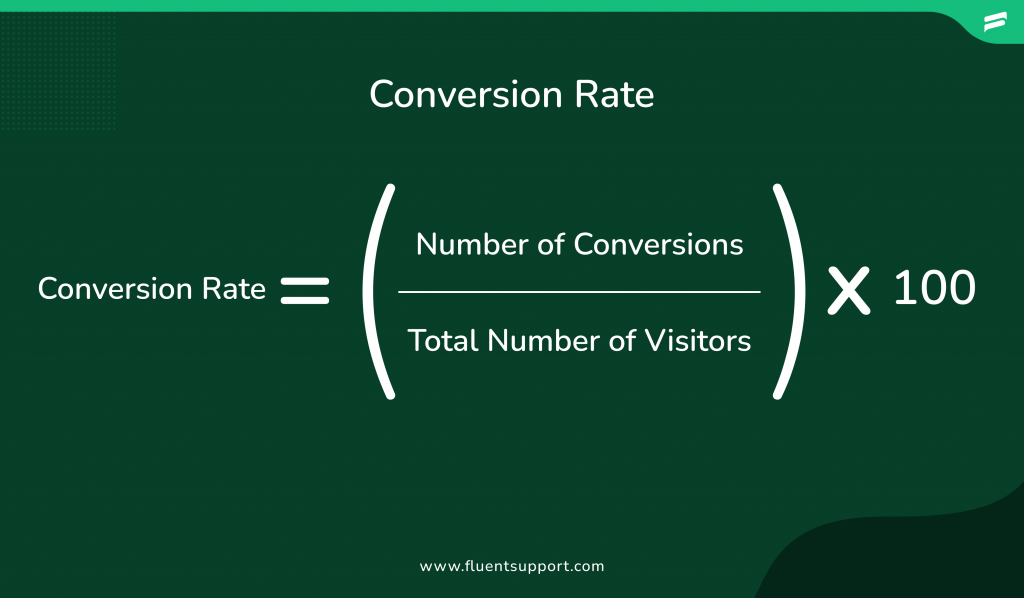
Conversion rate measures the success of turning potential customers into actual buyers. Knowing the conversion rate helps businesses identify how to improve the customer experience at different touchpoints.
Divide the no. of conversions by the total visitors, with a percentage. You will get the conversion rate.
For example, a site that has 10000 visitors and 500 orders for a specific time being, the conversion rate for that would be 5.0%. That shows the impact of a positive customer experience on successful transactions.
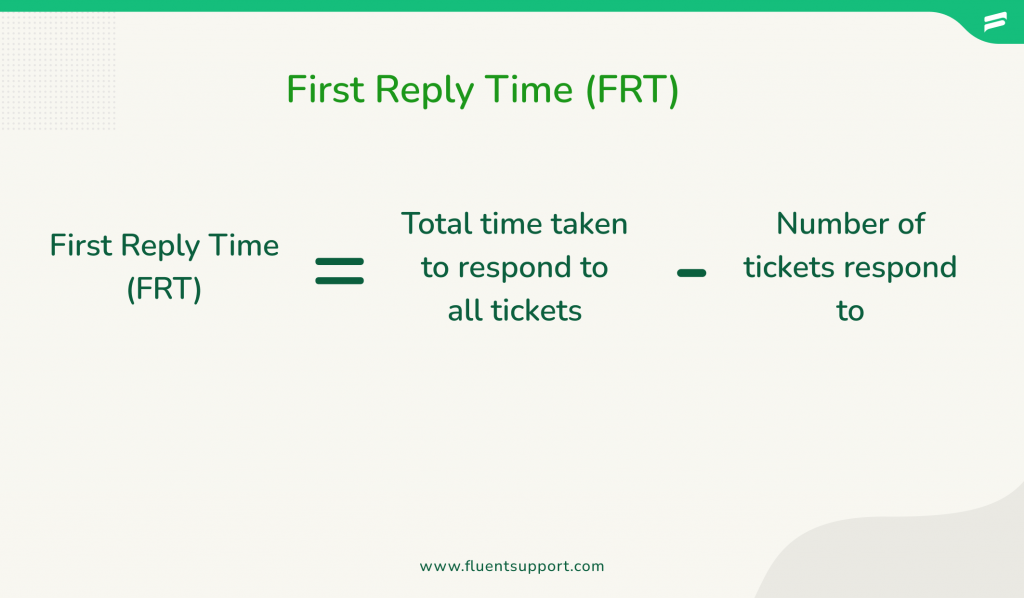
8. First Reply Time (FRT)
First Reply Time (FRT) measures how quickly a support agent responds to a customer support ticket. It’s crucial as it reflects customer priorities—speedy resolutions matter most.
You can calculate FRT by tracking the time between a customer’s request and the agent’s response, it ensures timely assistance.
To calculate, measure during business hours, consider medians over averages, and incorporate it into service reports. Faster FRT correlates with higher customer satisfaction, and it signals care and responsiveness.
It’s a key metric for staffing plans, ensuring the customer service targets align perfectly.
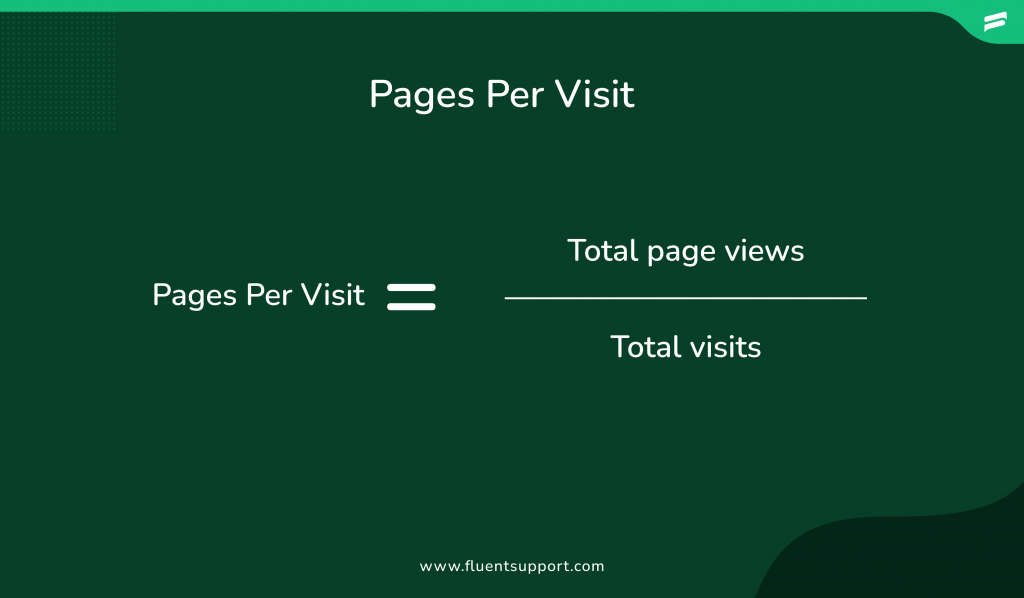
9. Pages per Visit (PPV)
Pages per Visit measures the average number of pages a user views during a single website visit. It indicates visitor engagement and content relevance. So, the more time spent, the better, signaling relevant and captivating content.
This is what a Pages per Visit report looks like:
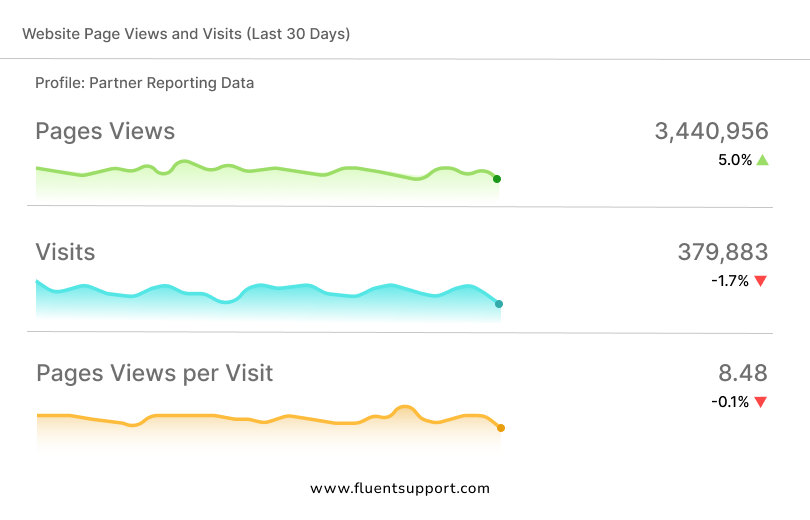
To calculate Pages per visit divide the total pageviews by total visits, it measures the average number of pages viewed per session. When paired with other engagement metrics, the metric discloses insights into on-site activities, user stickiness, and the likelihood of achieving website goals.
For website owners, the aim is to enhance user engagement, keeping them interested and encouraging further exploration. Based on the metric report you need to refine your content and enrich the overall customer experience.
10. Average Resolution Time (ART)
Average resolution time measures the average duration for customer care agents to resolve issues.
Simply, divide the total resolution time by the number of resolved tickets and you’ll get the average resolution time. It directly mirrors team efficiency and customer satisfaction.
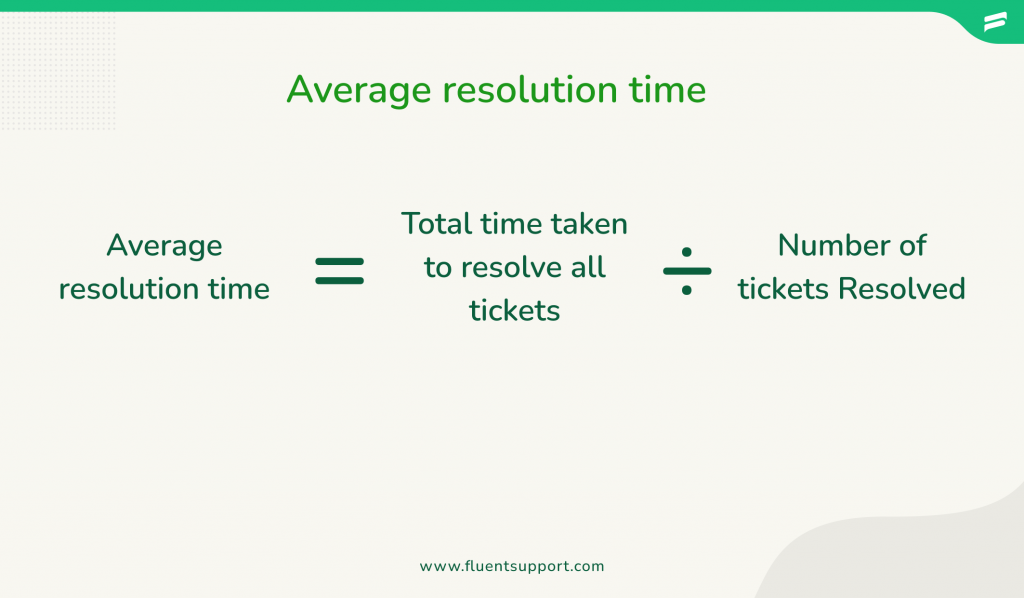
A low-resolution time signals prompt responsiveness, fostering customer delight. Conversely, long resolution time indicates slow responses and a compromised experience.
11. Customer Churn Rate (CCR)
Customer Churn Rate (CCR) measures the percentage of customers who cancel their subscriptions over a defined period. (This can range from monthly to annually or even daily for fast-moving SaaS companies)
You can calculate the churn rate by dividing the customers who cancel subscriptions by the total customers within a time frame.
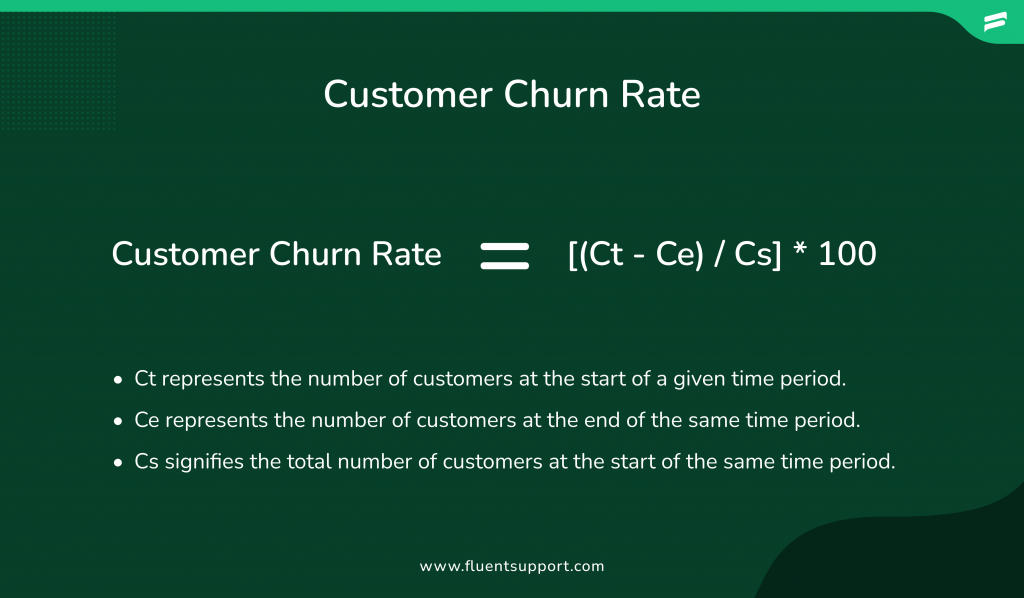
The metric is especially crucial for companies that rely on recurring revenue streams. If customers depart before a company can recoup their customer acquisition cost, it can lead to financial difficulties.
12. Cart Abandonment Rate
The average cart abandonment rate is 69.99%, an average from 48 cart abandonment studies. The cart abandonment rate has hovered between the 68% and 70% mark steadily since 2014.
Cart Abandonment Stats, Hotjar
Cart Abandonment Rate shows the percentage of customers who abandon their online shopping carts without completing their purchases.
First, divide the number of completed transactions by the number of people who started to buy stuff. Then, you subtract that from one and multiply by 100. That’s your Cart Abandonment Rate!
High abandonment rates point to checkout issues like confusion, unexpected costs, or complex sign-ups. By reducing cart abandonment, businesses can create a smoother and more satisfying shopping journey for users.
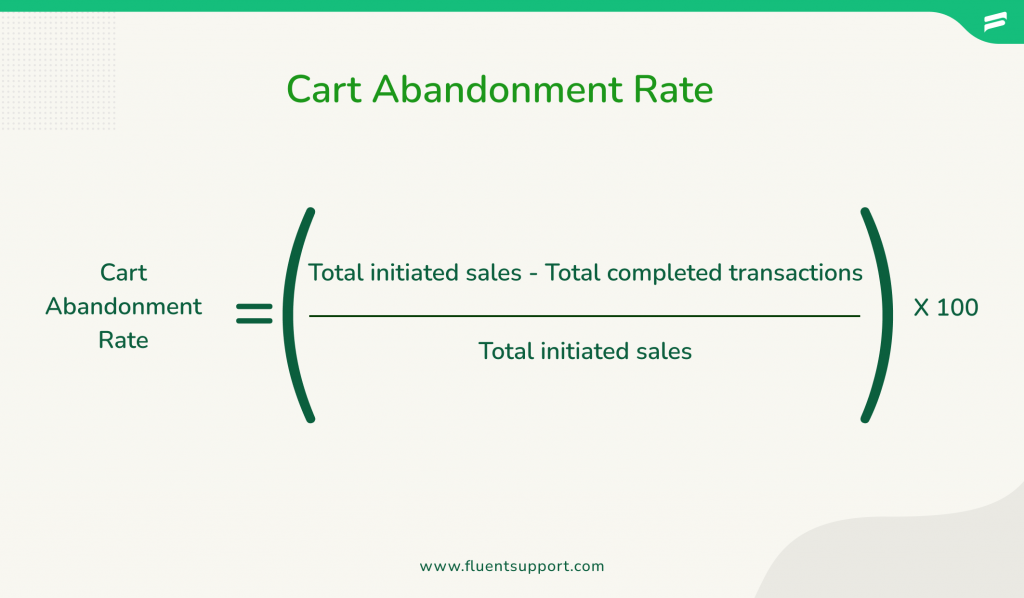
By reducing cart abandonment, businesses can create a smoother and more satisfying shopping journey for users.
13. Direct Traffic
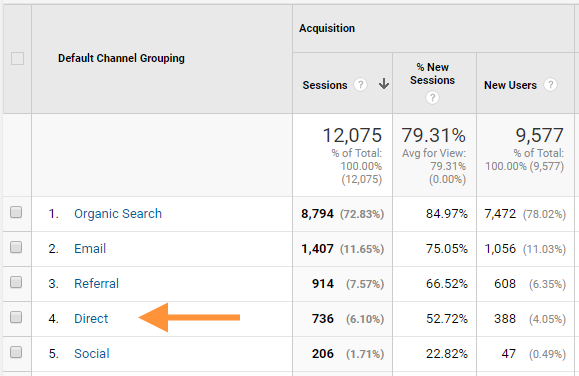
Direct Traffic refers to visitors who land on your website by directly typing the URL, clicking shared links, accessing offline sources, or using bookmarks.
It helps gauge brand awareness and customer engagement, ultimately contributing to future growth. You can easily track Direct Traffic rates using tools like Google Analytics, allowing you to monitor and enhance the customer experience.
Wrapping up
In conclusion, defining and prioritizing customer experience KPIs is a personalized journey for every business. The key lies in resolving customer issues and fostering a superior experience tailored to your unique business landscape.
Focus on touchpoints, understand their perspective, and refine the journey. Implementing these CX metrics effectively can catapult your customer experience, fostering increased sales, customer loyalty, and stronger relationships.
Start off with a powerful ticketing system that delivers smooth collaboration right out of the box.
Related Articles
502 Bad Gateway Error: What Is It And How To Fix
If you do not take any steps to…Error Code 520: What It Means and How to Fix It
Error code 520 means Cloudflare got an empty…


Leave a Reply