
Pages Per Visit (PPV) – A Simple Guide

By Uttam Kumar Dash
January 30, 2024
Last Modified: March 27, 2024


Wondering what’s a good benchmark for user engagement on your website? We measure this with the metric called ‘average Pages per Visit’.
Whether the number of average Pages per Visit or PPV is good or bad depends on a lot of factors. For example, your business model, industry, etc.
However, in September 2022, “Littledata surveyed 5,941 sites and discovered that, on average, users view 2.6 Pages per Session. And, the top 20% of websites get 4.0 pages per session.”
So, if your site scores above on average, 2.7 to 4.4 Pages per Visit is a very good number, and you’re surely outperforming the majority!
Now, let’s cut through the clutter and understand the concept of ‘pages per visit.’ No jargon, no fuss—just the essentials you need to grasp this engagement metric.
Let’s get started!
What is Pages Per Visit (PPV)
Pages per Visit or PPV is a user engagement metric that measures how many pages, on average, users view during a single visit to a website.
It serves as a key indicator of user interest and interaction. Pages per Visit is like counting how many pages people look at when they visit a website within a single session.
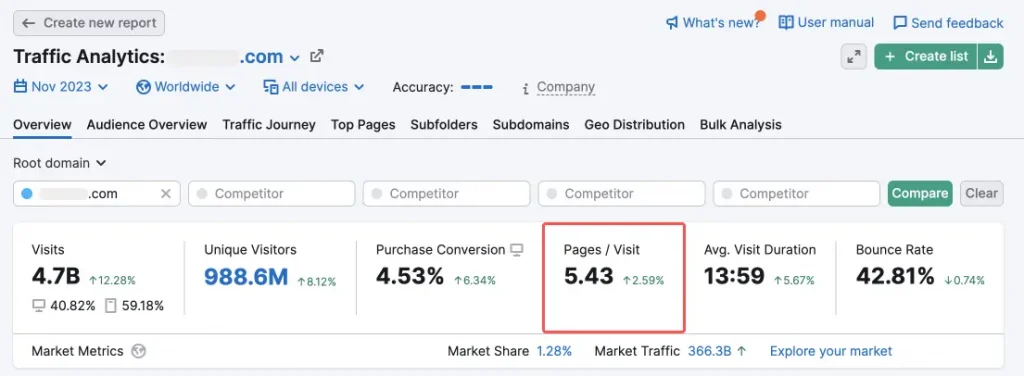
If they look at a lot of pages, like the image placed above, it means they really like what they find there. It helps us know if the website or the pages are interesting for visitors and how well it’s set up for them to explore better.
Why Pages per Visit is important
Tracking an average Pages per Visit is important for understanding the overall user engagement. Analyzing how many pages visitors view provides insights into the site’s appeal and stickiness. Also, it helps measure the potential for achieving goals, such as increased page views or purchases.
So, in short, we can say, Pages per Visit is important because it,
- Measures user engagement and interest in your content.
- Reflects the stickiness of your website—how long users stay.
- Indicates the likelihood of users completing desired actions, such as making purchases.
When Pages per Visit (PPV) matters
- Useful for content-driven sites where user exploration is vital.
- Relevant for e-commerce websites that are aiming to increase product views and conversions.
- It helps identify areas for improvement in user experience, content layout, and page structuring.
When Pages per Visit (PPV) might not be a priority
- Single-page newsletter subscribing websites: Primarily focused on a quick, specific action (newsletter subscription).
- For transactional sites with a single specific goal (e.g., completing a form).
- Landing pages designed for quick interactions without extensive exploration.
How to measure Pages per Visit (PPV)
The formula for average Pages per Visit is:
Average Pages per Visit (PPV) = No. Page Pageviews During a Timeframe / No. of Visitors During a Timeframe
Pages per Visit with Google Analytics
Now, as all of us are quite familiar with Google Analytics (GA) let’s learn to track how many pages, on average, visitors view during a session. First, let’s go through it with a mix of GA data and some manual calculations. After that, we’ll move forward with the existing setup.
The formula for this calculation:
Average Page Views per Visit = Page View Events + Screen View Events / Total Sessions
Note:
- Page View Events: Tracks user views of specific pages on a website.
- Screen View Events: Records user views of different screens within a mobile app.
- Total Sessions: Counts all user visits or interactions with a website or app within a set timeframe.
Suppose for a specific timeframe according to your GA data, you have 20,000 Page View Events, 5,000 Screen View Events, and a total of 15,000 sessions. So, the average Pages per Visit will be,
= (20000 + 5000) / 15000
= 1.67
This means that typically each visitor views around 1.67 pages during their visit.
On Google Analytics 4 (GA4) you can find your property’s average Pages per Visit aka Pages per Session in this manner:
- Log in to Google Analytics.
- Select your property.
- Go to Reports.
- Click on Engagement.
- Click on the Pages and Screens option.
- On the right, you’ll find the average number of mobile app screens or web pages viewed per user by the title Views per user.
- Adjust the timeframe as you need to.
Similar to Google Analytics, there are other tools that offer average Pages per Visit metrics. For example, Similarweb, HubSpot Analytics, etc.
Final thoughts

Every contact we have with a customer influences whether or not they’ll come back.
Kevin Stirtz, American Author
We have to be great every time or we’ll loose them.
Finally, along with Pages per Visit use other key metrics, like session duration, First Response Time, conversions, etc. Also, try to gather customer feedback data using various methods for a better picture.
To boost your site’s average Pages per Visit, optimize site navigation with clear Calls to Action (CTAs) and internal links. Moreover, try to craft better compelling content, and reduce FRT.
Remember, for a higher on average Pages per Visit there’s nothing better than securing a seamless user experience and a good amount of engaging content.
Related Articles
502 Bad Gateway Error: What Is It And How To Fix
If you do not take any steps to…Error Code 520: What It Means and How to Fix It
Error code 520 means Cloudflare got an empty…


Leave a Reply