Big Data Analytics to Improve Customer Experience

By Md. Ariful Basher
August 1, 2023
Last Modified: November 13, 2025


Big data and data analytics have been trending for the past few years. And big data has been used for quite some time now in various fields. But is it possible to use data analytics to improve the customer experience?

Data is the new oil, but unlike oil, data can be acquired, produced, and reused infinitely.
Clive Humby
Statistics showed that real-time customer analytics helped 53% of businesses improve their customer journey maps and customer experiences. Furthermore, 58% say their companies have seen a significant increase in customer retention and loyalty as a result of the use of customer analytics.
Do you know how we know this state? We know this because of big data and data analysis. So let’s start with the basics.
Big data and Data analytics
Everything is data. But we cannot call every bit of data a big data.
What is big data?
Big data simply refers to a large set of data that contains lots of variables and is complex to sort and organize to extract a particular result using traditional, simple methods.
Criteria to be a big data
There is a checklist to be called as big data. A dataset has to check at least these 5 Vs for this title to be achieved.
204 million emails are sent every minute.
1. Volume
Volume is the first criterion. Hance, big, refers to the volume of the data. The volume of the data has to be large. For example, 204 million emails are sent every minute. This is big data.
2. Veracity
It refers to the quality of the data. Not only has to be big, but it must also be reliable. It depends on the source of the collected data and how it’s collected.
3. Variety
It refers to the nature of the data. A data set might be structured, unstructured, or even semi-structured. In modern days, data has even more varieties. such as photos, videos, emails, and audio, are new forms of data. For a fresh approach to visual data, make use of an AI-powered editor. This can help you effortlessly refine and reshape your media content.
4. Value
If the different varieties of a data set don’t add any value, then that’s not good big data. Every variety must have significant value.
5. Velocity
It refers to the frequency of data generation. How fast new entities are adding to the data is important. And is it meeting the demand?
What is data analysis?
It is a process of inspecting, cleaning, transforming into a pattern, and modeling in a way that is easy to understand for everyone.
The goal of this is to provide useful information, a unified conclusion, and an easy-to-understand explanation.
Data analysis vs analytics
We often confuse these two terms, thinking they are the same word. However, they are two completely different words.
Data analysis is used when referring to discovering insights and useful information from data.
On the other hand, data analytics is used to gain insights into a particular topic, such as the performance of a support team, customer retention, or market leads.
Be where your customers are!
Hear your customers wherever they need you.
Why big data analytics is important
To put it in simple words, it is so important that 91% of company founders have increased their investment in data collection and analytics.
Here are a few benefits of data analytics:
1. Reducing costs
Big data can help understand unnecessary expenses. Also, it will help you figure out more effective and efficient ways. And the result is a cost reduction.
2. Making faster, better decisions
When you have the full picture in front of you, it will help you predict future trends. Hance, faster decision-making
3. Developing new products and services
Data about the products will help you understand the gap in your service. This will create service and product ideas to extend your business.
4. Developing a new marketing strategy
By conducting a big data analysis, you will know what strategy is working and what is not. So, a faster, more reliable decision can be made in terms of marketing strategy.
5. Improved customer service.
Finally, with big data analytics, you can provide better customer service.
We will deep-dive into this part.
Data analytics to improve customer experience
If you cannot improve your customers’ experiences, you cannot survive. It sounds a bit hard, but it’s true. Big data analytics are the key to creating a better customer experience.
1. Identify customer needs
A large dataset will let you know what your customers are asking for. You can figure out the gaps. As a result, you will be able to list out the customers’ needs.
Unstructured customer survey data can give you new feature ideas or service ideas to work on. Eventually, you will fulfill the customer’s needs.
2. Monitor product usage
Data on product usage is vital. This will tell you the functionality of your product. This data will show you how user-friendly your product is. Or how easy it is to get your service to a customer.
These data matrices will help you improve your product’s usability or service. Because of this, your customer experience will be better.
3. Track customer pain points
From different levels of survey data, you can determine the touchpoint status of a customer with your business. You will have a clear picture of all the pain points your customers go through.
By listing out all the pain points, you can work on them. As it’s big data, it will also help you understand how it will work. And you can bring down customer churn and improve the number of loyal customers.
4. Increase customer retention
A large set of data will reveal a customer’s behavioral pattern. This will tell you how customers are converting. Based on that data, you can design a solid conversion funnel.
This will not just ensure better lead conversion but also increase customer retention.
By building a data warehouse, companies can centralize customer insights from multiple touchpoints to identify patterns and improve the retention strategy even further.
5. Monitor customer satisfaction
How satisfied are you? This is not a simple question. You can learn a lot from its data. By the way, this type of survey is called NPS, or net promoter score.
A satisfied customer will become a loyal customer. And loyal customers are your free marketers. They are active brand advocates for your brand.
Data analytics will help you understand what percentage of customers are happy with your service or product. This will open up the scope for improvement for a better customer experience.
How to create big data
For big data, collecting data is a continuous process. The data builds over time through various methods. The reports generated by various software, such as helpdesk plugins, customer relationship management systems, or Google Analytics data, could be used for this purpose.
Data could also be collected via surveys. Surveys like customer feedback or customer support data are highly effective in understanding the customer experience.
If you are trying to find the usability of your product, then dark data can be very handy for this. This is also a large-scale data set that is being ignored because of its vastness.
Let’s say you have collected a huge amount of data. Now what? You have hundreds or thousands of numbers or words written on a spreadsheet. You need to find the right information from this.
How analyze big data
Large-scale data needs specialized tools or programs to analyze. Your regular, simple use of Google Sheets is not going to be rough for this.
First, you have to make the dataset more understandable. Because usually it might look like this.
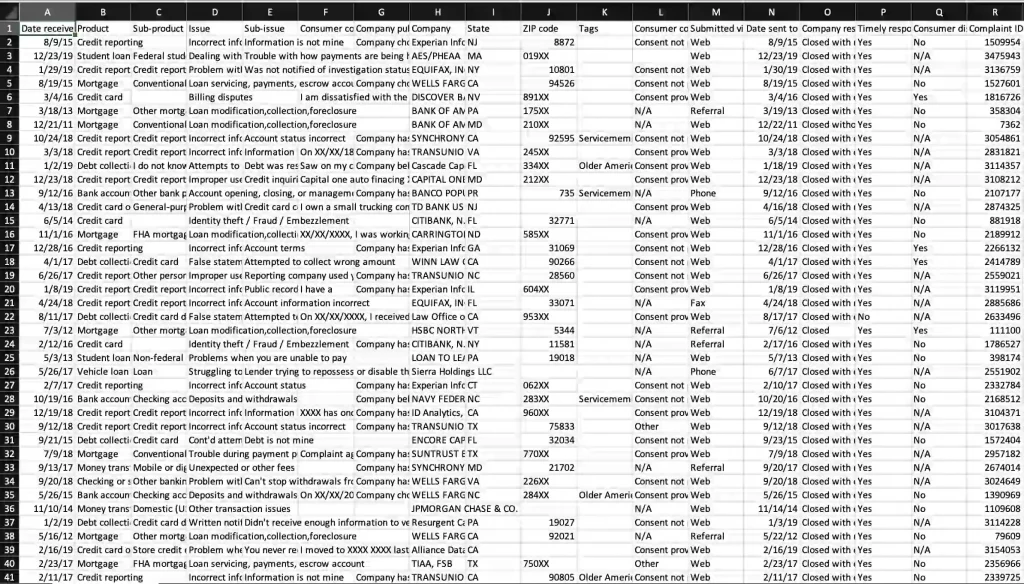
You have to start by cleaning the data. The data cleaning process begins with deleting duplicates. Then next, you have to figure out which entries are useless. A large data set like this might have a lot of incomplete entries. Those need to be deleted.
Next, you have to decide what information you want to find out from this big data. After fixing that, you have to select what you specifically need from this data set. Extract those into a different file.
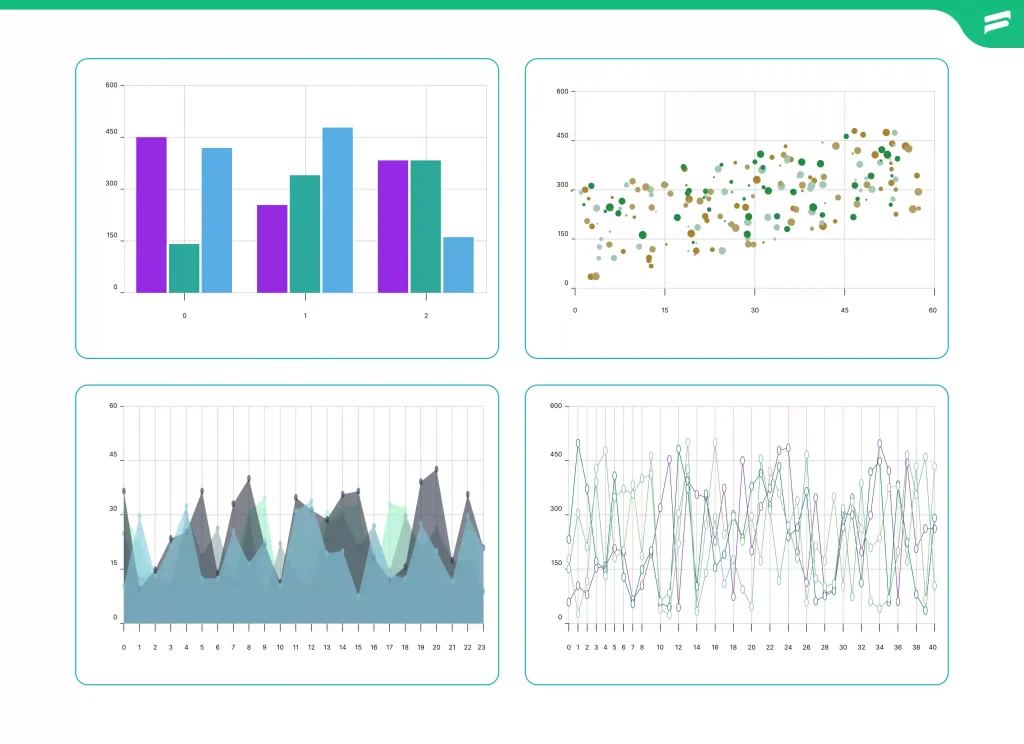
Finally, start finding patterns in the data. These data patterns can be visualized in tabulated form or in different graphs.
Different tools for data analytics
There are several data analysis tools for this job. Different tools have their advantages and disadvantages. The use case solely depends on your expertise and the purpose of the data analysis.
- Microsoft Excel. Commonly used tool in cases of simple to mid-level data analysis.
- Python. It’s a programming language with extensive power. It is fast, highly flexible, and can handle any size of data easily. Python can be used to develop software as well.
- R. It is tailored programming only for data analysis. As it is also a programming language, it is fast, highly flexible, and can handle any size of data easily.
- Jupyter Notebook. It is a web-based computing platform. You can use a variety of languages, like Python or R, to compute larger data sets.
- Tableau. It is a more advanced version of Microsoft Excel. This tool has dynamic features to create multi-layered data visualizations.
- Google Sheets Add-ons. Google Sheets, though often seen as a lightweight tool for managing data, can be significantly enhanced through specific Google Sheet add-ons. It can handle tasks such as connecting to APIs, performing statistical analysis, or even automating workflows.
To use all of these, you need to go through some level of learning curve. But once you master any of this, you can handle any type of data like a magician.
Resources of open source data
Open-source data is very useful. If you do have data by yourself or just want to see the external status of your market, open source data can be very handy.
- Google Public Data
- Registry of Open Data on AWS
- Kaggle Datasets
- U.S. Government’s Open Data
- Yelp Dataset
- World Bank Open Data
- Open Data Monitor
- WHO Data
- Unicef Data
But besides that, if you are looking for a bit of specific data analytics to improve the customer experience, then you can search for it. Google has a special search page for that.
Final thoughts
Big data analytics is a powerful tool that can be used in many ways. This can provide insights into customer behavior, needs, and, most importantly, pain points.
You can personalize interactions at different touch points by analyzing big data. By improving customer service and developing new products and services, you can extend your business.
In today’s competitive marketplace, businesses are investing to build personalized data. Data science is integrating with the business world.
Because the whole industry is running on data. So, the key to a sustainable business is the use of data analytics to improve the customer experience.
Start off with a powerful ticketing system that delivers smooth collaboration right out of the box.
Related Articles
Email or Help Desk Software: Why Not Both?
Email help desk software turns a messy support…Fluent Support 2.3.0: MCP Server, Multi-Provider AI, Commerce Workflow Conditions, and More
Fluent Support 2.3.0 ships a Model Context Protocol…


Leave a Reply