
RICE Framework: Calculate & Rank Projects Based on RICE Score

By Prosanjit Dhar
November 10, 2025
Last Modified: November 10, 2025


Too many ideas, too little time. Which one should you prioritize first?
That’s where the RICE Framework comes in.
Originally built for product management, RICE isn’t just a prioritizing framework. Instead, it’s a decision-making compass for marketers, CX strategists, and growth leaders.
So, just start your RICE calculation right now!
What is RICE framework?
“RICE” is the acronym for Reach, Impact, Confidence, and Effort. It’s a project prioritization framework that helps teams to compare and prioritize projects by evaluating them based on these four factors.
And, the RICE score formula looks like:
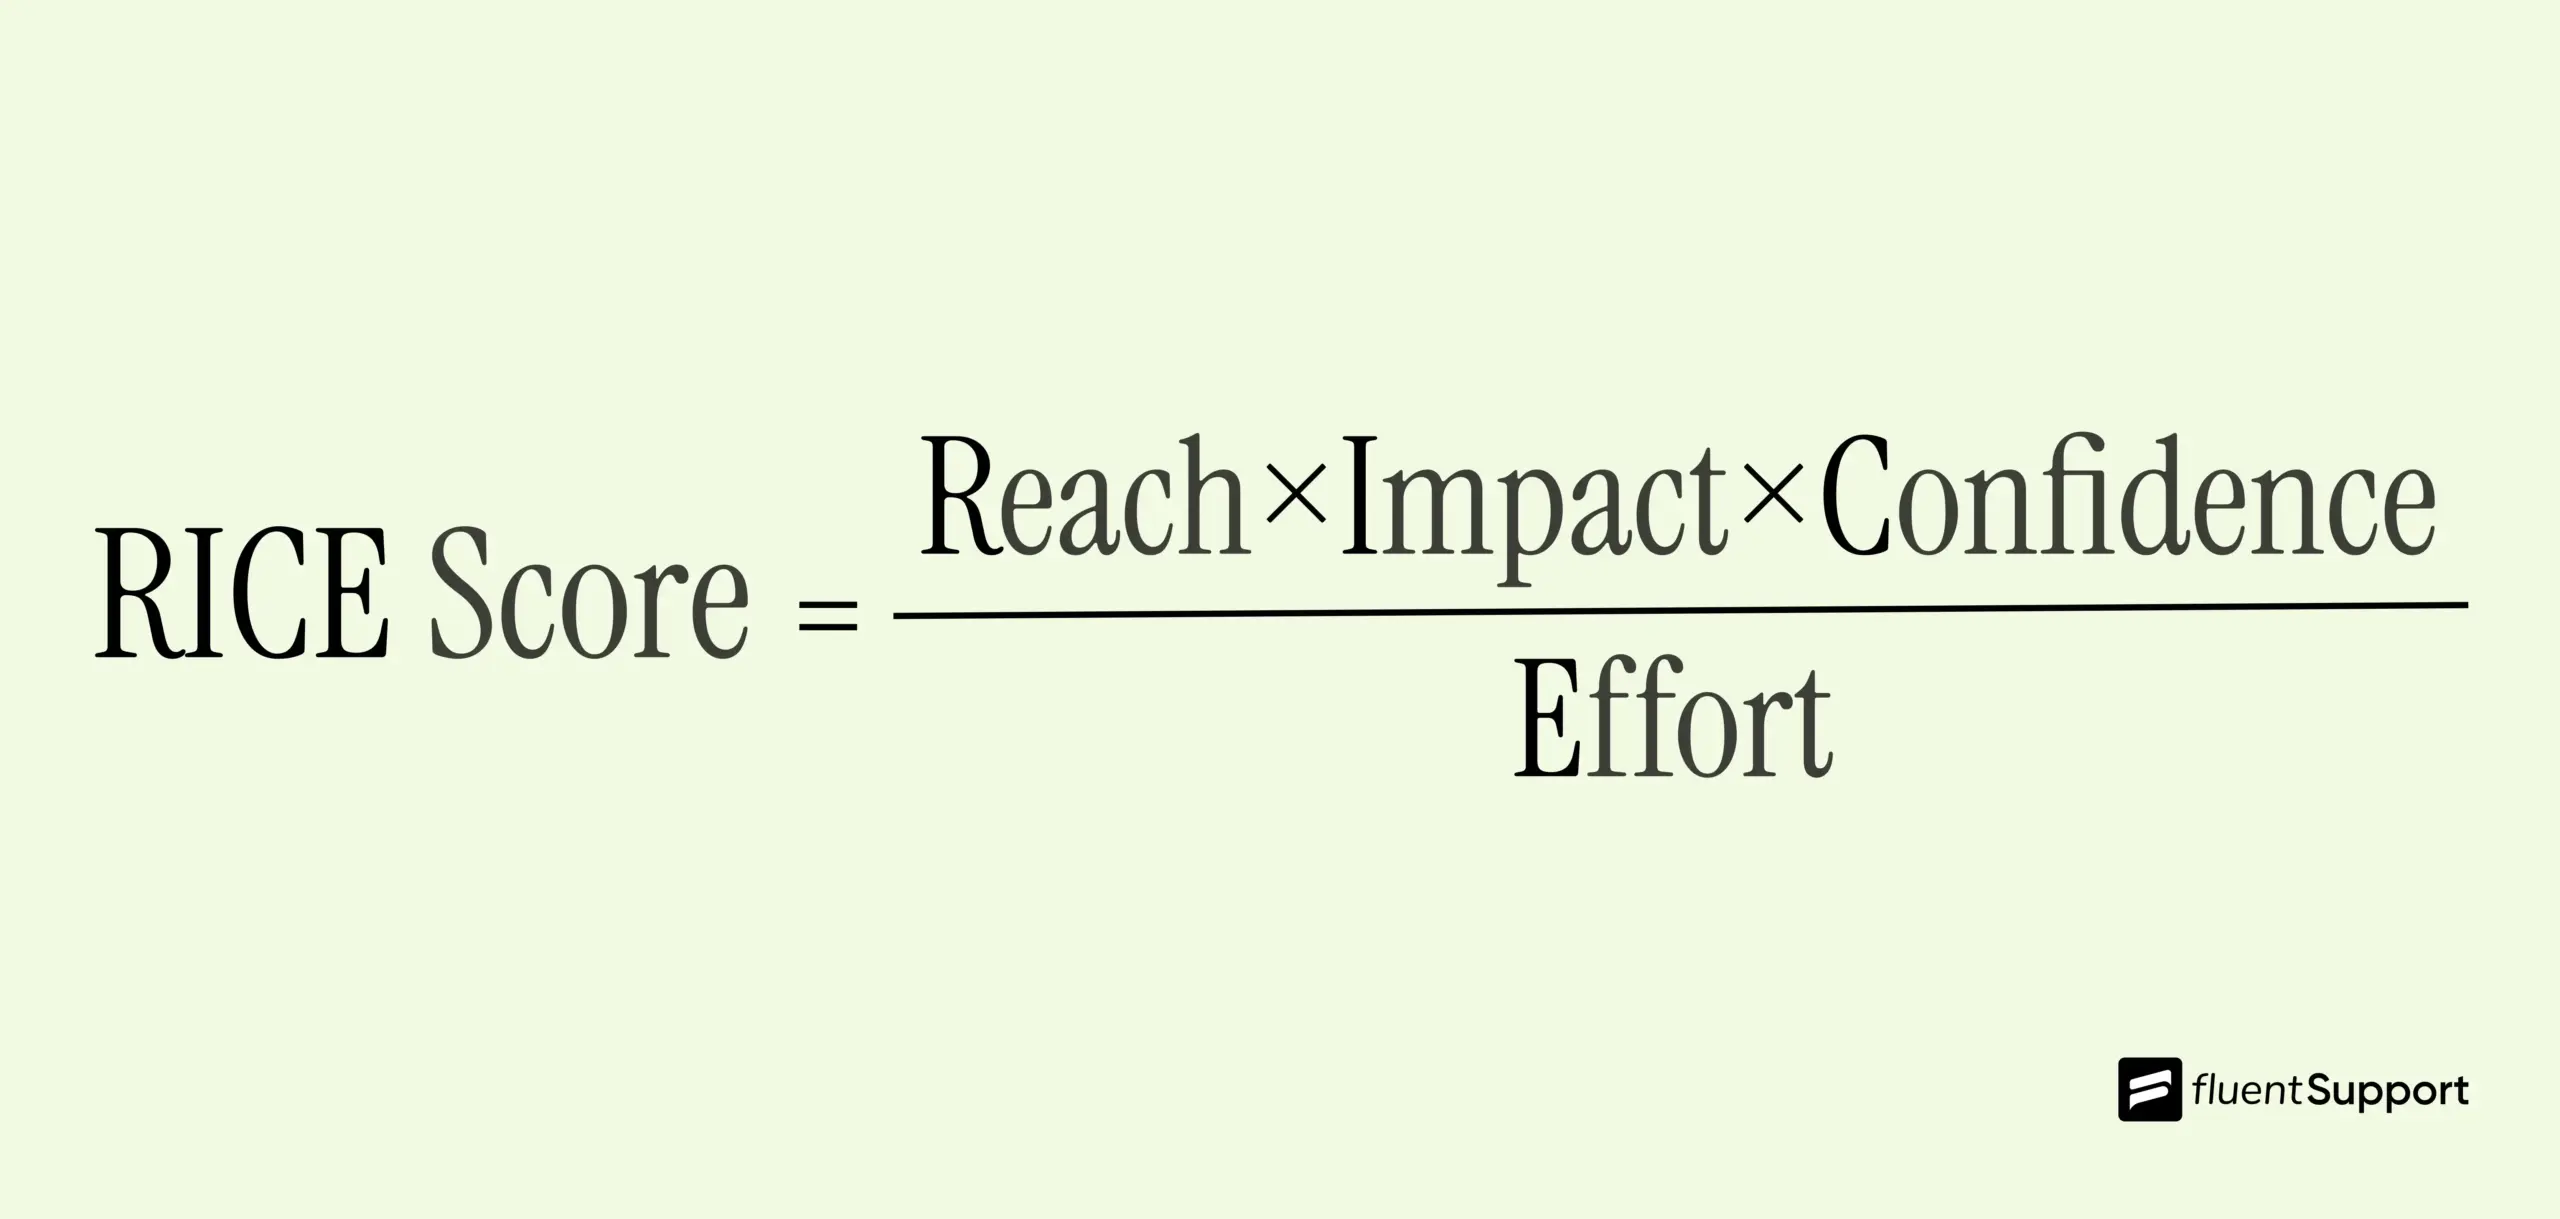
When you assign each idea a RICE score, you’re essentially calculating how much impact you can create per unit of effort.
In other words, it helps you find the best ROI on your team’s time.
1. Reach – How many people will this actually help?
The first question to ask: Who’s affected by this idea?
Reach helps you measure how many users, customers, or actions will experience the change within a time frame (a month or a quarter).
It’s easy to make assumptions here, but the best teams use data: product analytics, user funnels, or behavior tracking.
Example:
Project A: Around 700 customers go through this workflow each month, and about 25% would benefit directly. → Reach = 700 × 25% × 3 months = 525 customers per quarter.
Project B: Every paying user interacts with this feature quarterly. → Reach = 2,400 customers per quarter.
Project C: This affects a one-time batch of 1,000 existing users, with no ongoing effect.
2. Impact – How much difference does it make?
Now that you know how many people you’ll reach, it’s time to estimate how much it’ll change things for them.
Impact is where you ask: If this project succeeds, how will it move the needle on our goal?
That might mean increasing conversions, reducing churn, or improving customer satisfaction.
Since hard data isn’t always available, use a consistent rating scale instead:
| Level | Multiplier |
|---|---|
| Massive impact | 3 |
| High impact | 2 |
| Medium impact | 1 |
| Low impact | 0.5 |
| Minimal impact | 0.25 |
Example:
Project A: Major boost to activation rates → Impact = 3
Project B: Somewhat improves usability → Impact = 1
Project C: Moderate improvement for a key flow → Impact = 2
Remember, this doesn’t need to be perfect math. It just needs to be consistent and honest.
3. Confidence – How sure are you about this?
This is where RICE gets interesting. Confidence forces you to face how much (or how little) evidence you have.
It keeps excitement in check, especially for ideas that sound amazing but lack validation.
Use this quick confidence scale:
| Confidence Level | Meaning | Status |
|---|---|---|
| 100% | You have strong data across all estimates | High confidence |
| 80% | You have solid data for most, but not all, factors | Medium confidence |
| 50% | You’re mostly guessing or assuming | Low confidence |
Example:
Project A: Backed by usage data, research, and effort estimates → Confidence = 100%
Project B: Data supports reach and effort, but impact is unclear → Confidence = 80%
Project C: Many unknowns, mostly guessing → Confidence = 50%
It’s okay to have low-confidence ideas. But just recognize that their score carries more uncertainty.
4. Effort – What’s the real cost in time?
Finally, effort grounds your ambition in reality. It’s the total time your team needs to deliver the project, including product, design, and engineering.
We measure it in person-months (the work one person can do in a month).
Example:
Project A: Planning (1 week), design (2 weeks), dev (4 weeks) → Effort = 2 person/month.
Project B: Complex backend work + major UI revamp → Effort = 4 person/month.
Project C: Minor tweak, mostly engineering → Effort = 1 person/month.
Unlike other RICE factors, effort works in reverse, such as higher effort lowers your score.
How to calculate the RICE framework?
Once you’ve estimated all four factors, multiply the Reach, Impact, and Confidence scores for a project and then divide that product by the Effort score, using the formula:
This gives you a single number representing “total impact per time worked.” Higher RICE scores indicate higher priority, as projects are seen as more valuable and impactful.
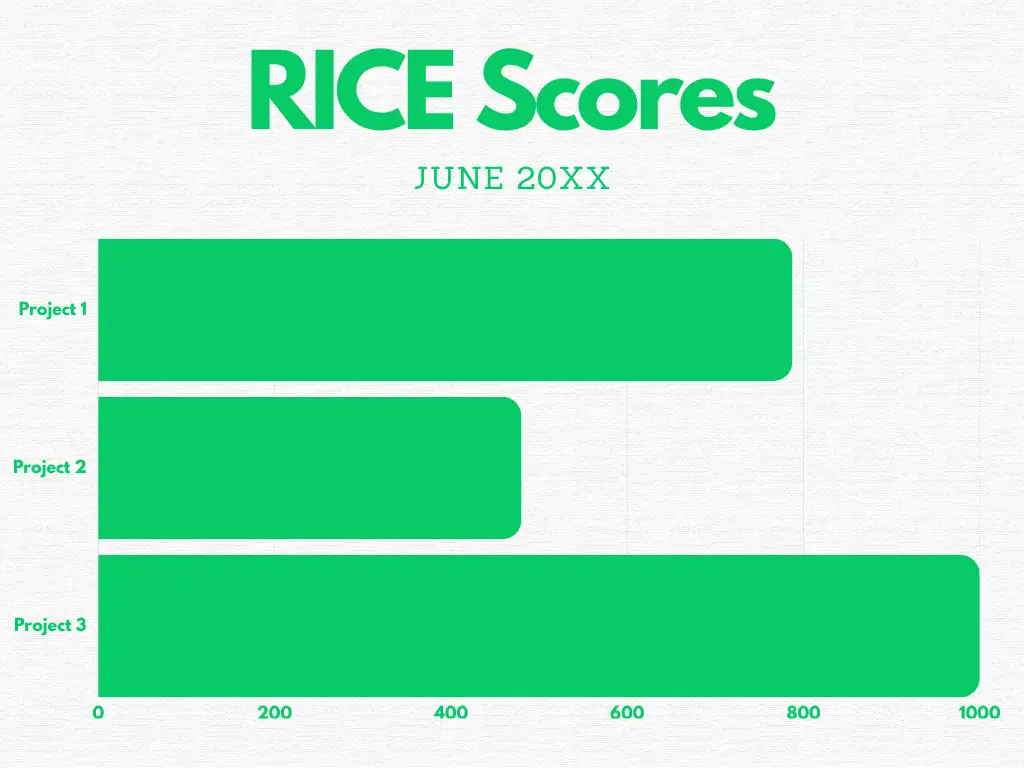
Let’s run through a quick example with our numbers from project A to C:
| Project | Reach | Impact | Confidence | Effort | RICE Score |
|---|---|---|---|---|---|
| A | 525 | 3 | 100% | 2 | 787.5 |
| B | 2400 | 1 | 80% | 4 | 480 |
| C | 1000 | 2 | 50% | 1 | 1000 |
As you can see, Project C stands out here, even with medium impact and low confidence. As it’s low effort makes it a high-leverage win.
That’s exactly what RICE helps you find. But how does RICE actually work in practice?
RICE Score Calculator
How to use the RICE framework?
The beauty of the RICE framework is that it’s flexible. Whether you’re a startup or a large enterprise with complex product pipelines, it gives structure to what often feels like chaos.
Let’s walk through a few practical examples that show how teams actually apply RICE in their decision-making.
Example 1: eCommerce company
An eCommerce company is exploring three possible upgrades for its online store:
- Sell any product types
- Rest APIs and webhooks
- Faster checkout experience
To find out which deserves priority, the team estimates the four RICE factors for each:
Sell any product types:
Rest APIs and webhooks:
Faster checkout experience:
Based on the RICE score, both Sell any product types and Rest APIs and webhooks score well because of their broad reach and high potential impact.
But checkout optimization still earns a spot in the future for being low-risk and quick to execute.
Sell Anything From One Place with FluentCart
Example 2: Mobile app team
Now, picture a mobile app team debating where to focus next:
- Introducing referral incentives
- Adding dark mode
- Revamping the onboarding flow
Here’s how RICE helps them bring clarity to the discussion:
Referral incentives:
Dark mode:
Revamping onboarding flow:
Based on the RICE score, referral incentives take the lead with the highest impact-to-effort ratio. The team now knows that even though onboarding redesign has potential, it’s better suited for the next cycle.
Example 3: Software company
Let’s take a B2B SaaS team juggling customer feature requests. They’re evaluating:
- Slack integration
- Advanced reporting dashboard
- Custom role permissions
Here’s how they break it down:
Slack integration:
Advanced reporting dashboard:
Custom role permissions:
The RICE score reflects, Slack integration clearly delivers the highest ROI with a broad reach, meaningful impact, and manageable effort. The team can now defend this prioritization confidently to leadership and customers alike.
Why CX and marketing leaders should adopt RICE
While RICE began in product teams, its true potential unfolds in customer experience and growth contexts.
Here’s why:
- Aligns teams on measurable outcomes: Everyone (from design to support) can see why one project outranks another.
- Brings emotional empathy into data: When you tie “reach” to “number of customers affected by a pain point,” you’re humanizing the data.
- Helps you defend priorities to leadership: Instead of saying, “We feel this is important,” you say, “This will impact 4,000 users with 95% confidence at half the effort.”
- Keeps momentum realistic: CX improvements often die due to over-scoping. RICE lets you start small but meaningful.
Final thoughts
The RICE framework is about clarity. It makes you pause and ask:
“Is this worth doing and why?”
For people working at the intersection of CX, growth, and marketing, that clarity is priceless. Because in a world overflowing with options, the smartest thing you can do isn’t to do more.
Start off with a powerful ticketing system that delivers smooth collaboration right out of the box.
Related Articles
Is “AI Brain Fry” Burning Out Your Support Team?
AI brain fry is a new form of…10 Startups Leading The Way In Customer Service
Here are 10 genuine startups that are leading…


Leave a Reply