The “Reports” is an advanced statistical analytics and reporting feature of Fluent Support. It provides an accurate view of the entire team’s performance and even allows you to track and measure the performance of individual support executives. This article will give you a focused overview of the dashboard in the “Reports” feature.
Reports #
You will find the “Reports” option from the top-left menu on your Fluent Support’s Dashboard. This will display Five different sections of ticket statistics and reports. These are:
- Personal Reports
- Agents Reports
- Products Reports
- Business Boxes Reports
- Activity Reports
In each Report’s section except Activity Reports, you’ll find a Bar Chart displaying Overall Ticket Activity statistics.
And, the ‘Current Overall’ section under the ‘Agents Reports Summary’ tab displays all statistics on an hourly basis e.g., average waiting time, response rates, interactions, etc. It’s effective for managing a large number of daily tickets.
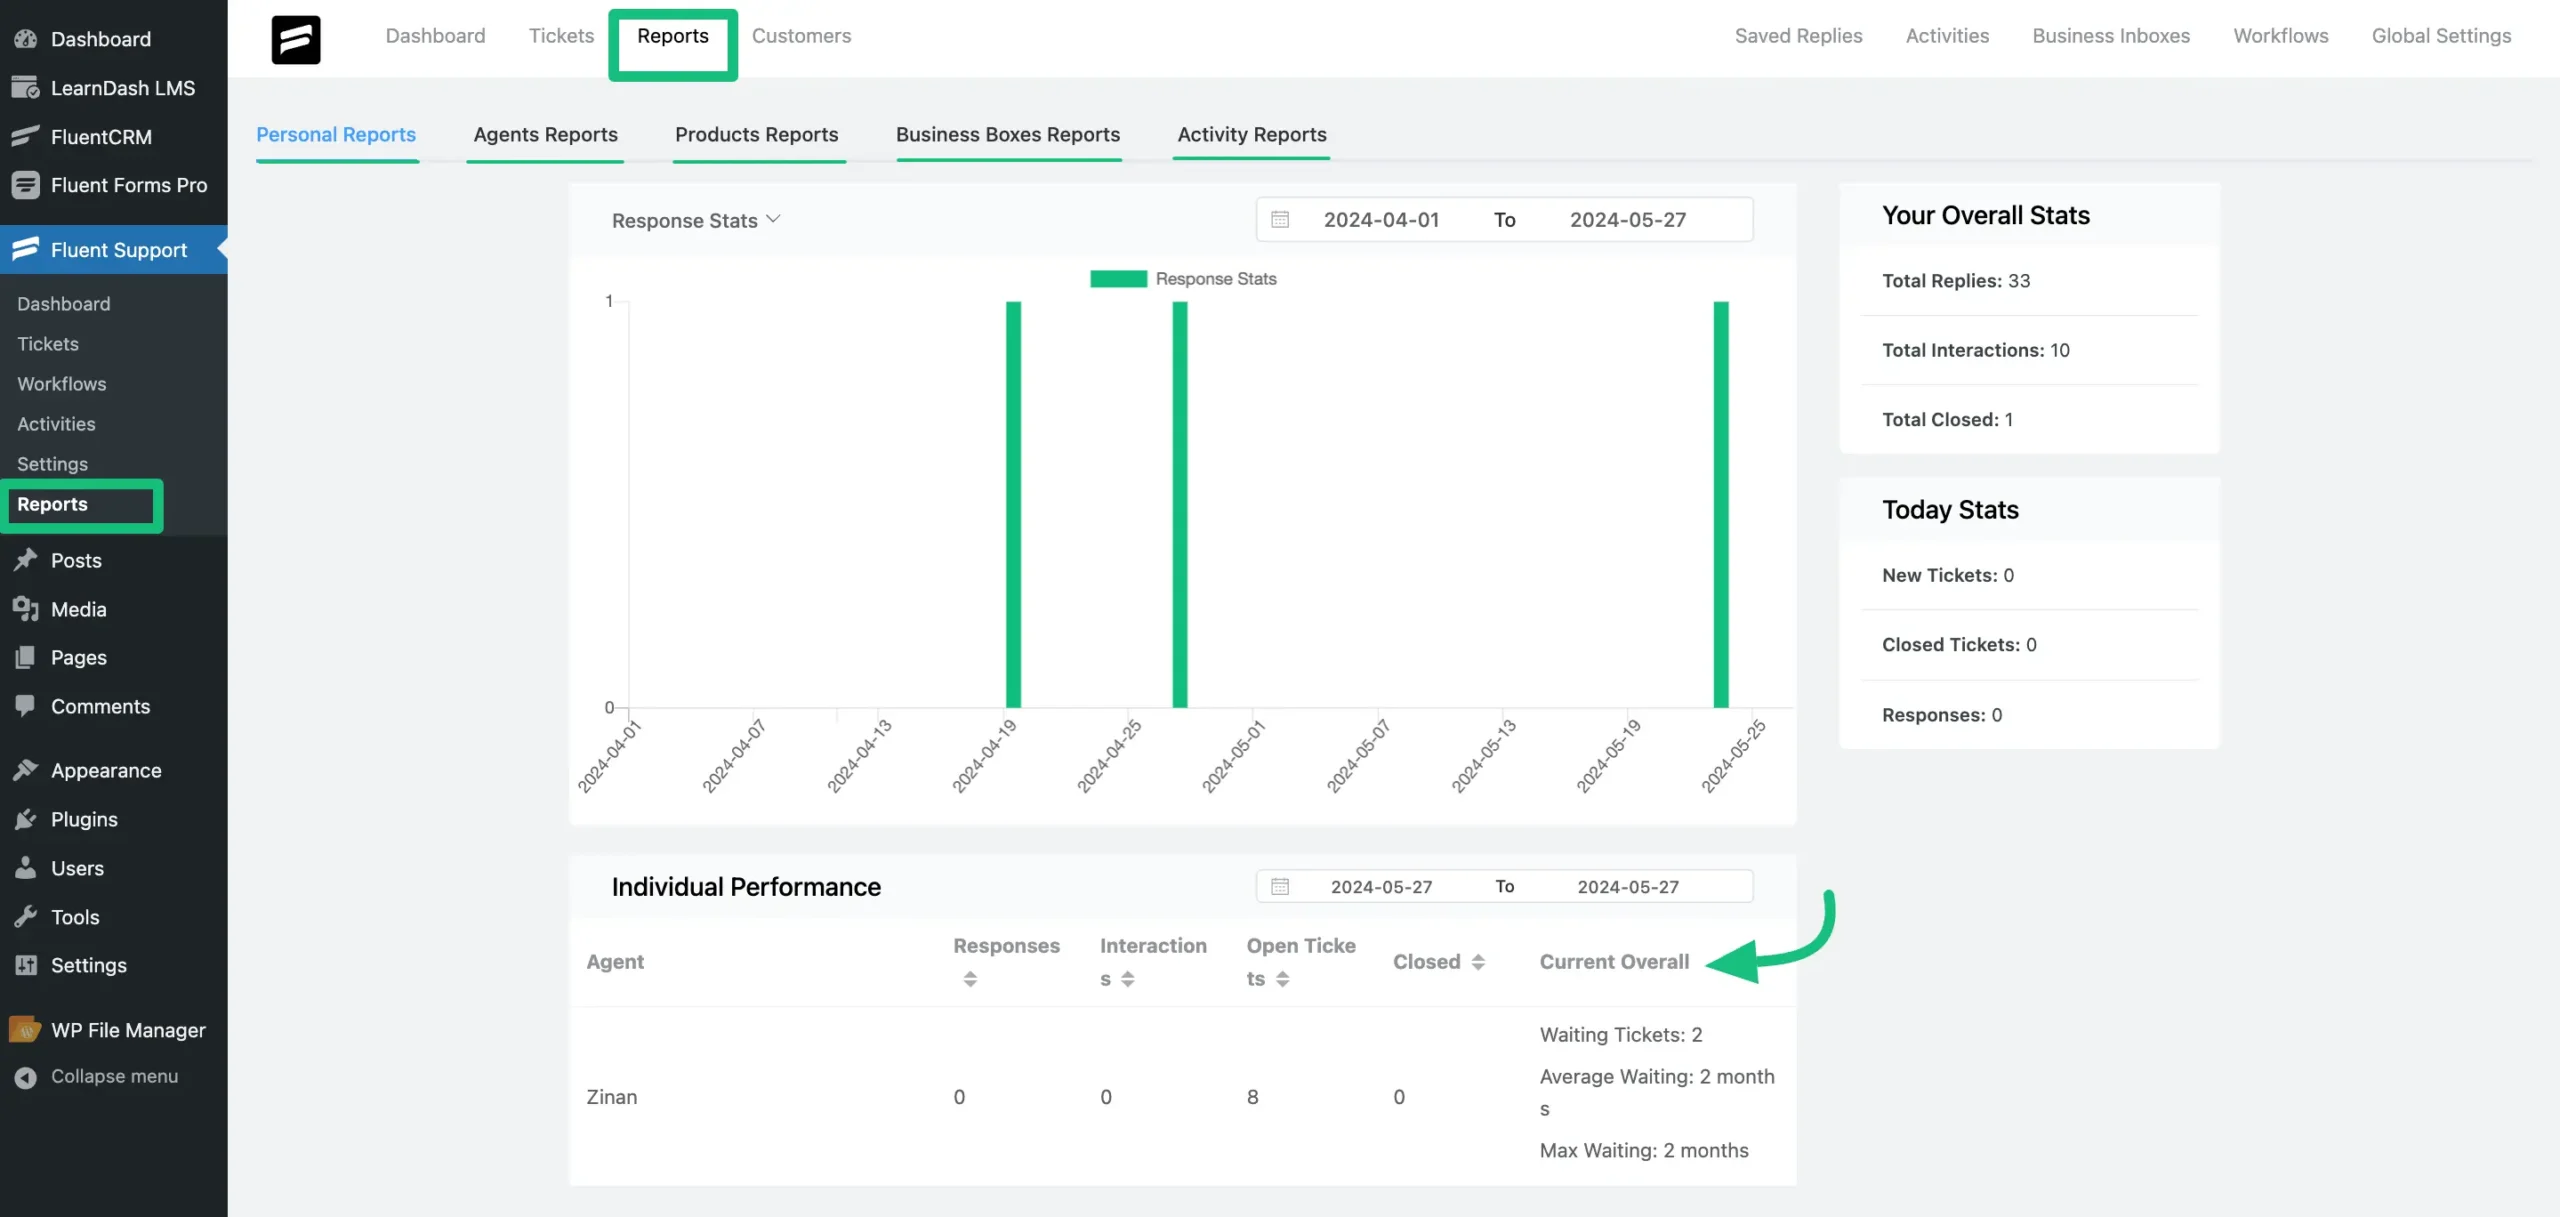
Personal Reports #
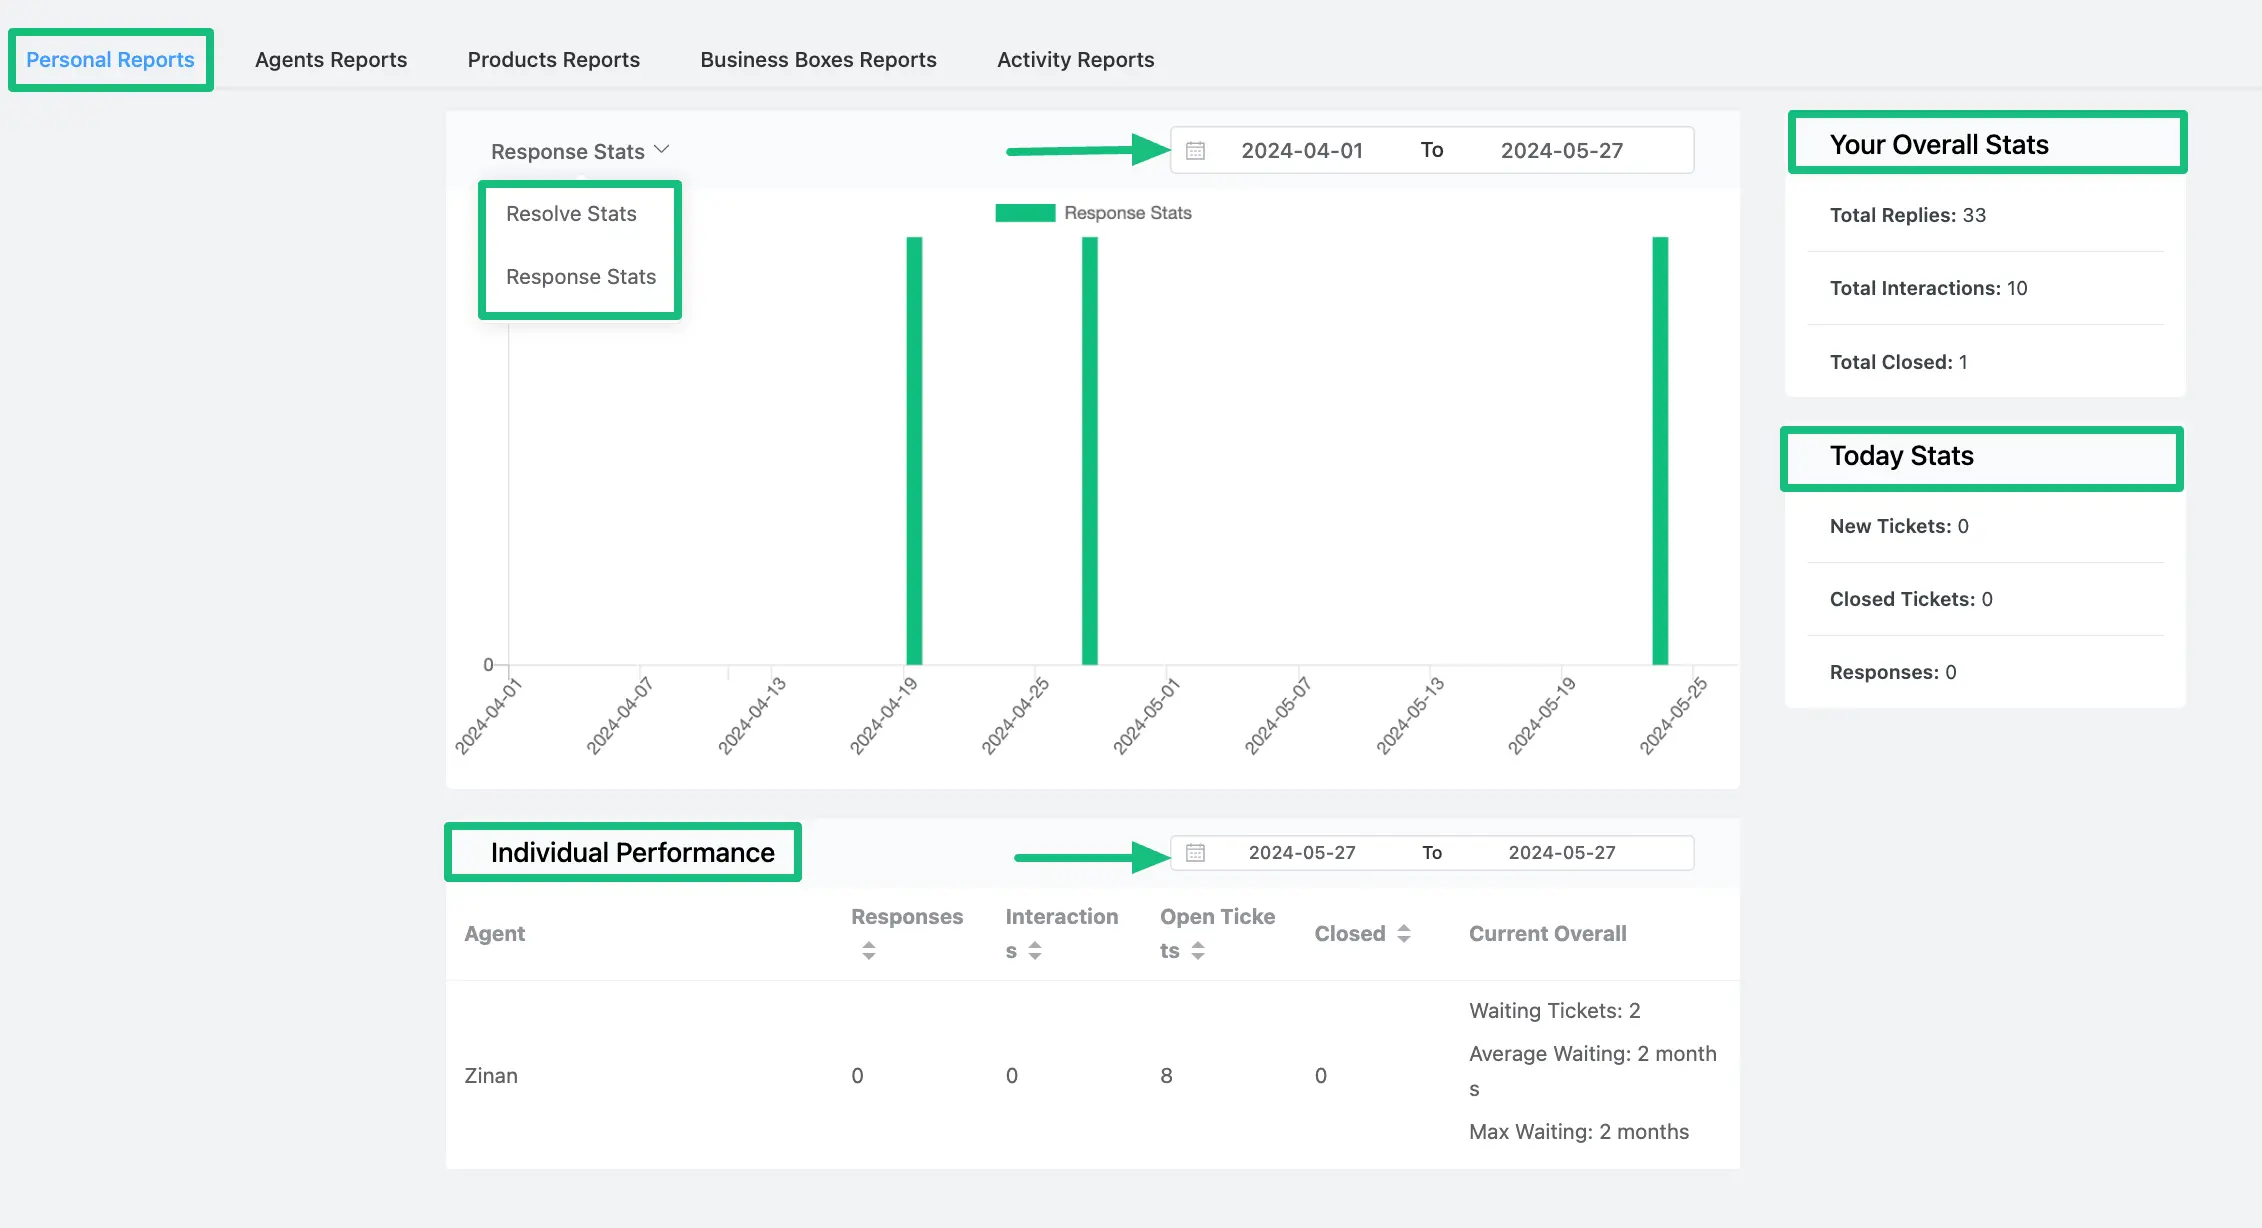
This ‘Personal Reports’ section displays the ticket statistics and personal reports of each support agent. These reports are specific to the individual agent, who will be able to view their report here.
- In this section, you can view individual statistics for both Resolve Stats and Response Stats.
- You can use the date filter to view reports from a specific range. On the right side, you can view Overall ticket statistics and Today’s ticket statistics.
- At the bottom, you will see the summary of the agent’s performance individually.
Agents Reports #
The ‘Agent Reports’ section shows the overall report of all the agents, and it is only accessible to the support agent or supervisor who has permission to view this page.
- In this section, you can review Ticket Stats, Resolve Stats, and Response Stats
- You can use the All Agent filter to select the individual agent’s statistics you want to view
- Additionally, you can utilize the Date filter to view ticket statistics for a specific period
- On the right side, you’ll see a Quick Stats report that displays the total ticket statistics for the Support Agent, and a Today Stats report that presents the overall ticket statistics for the current day.
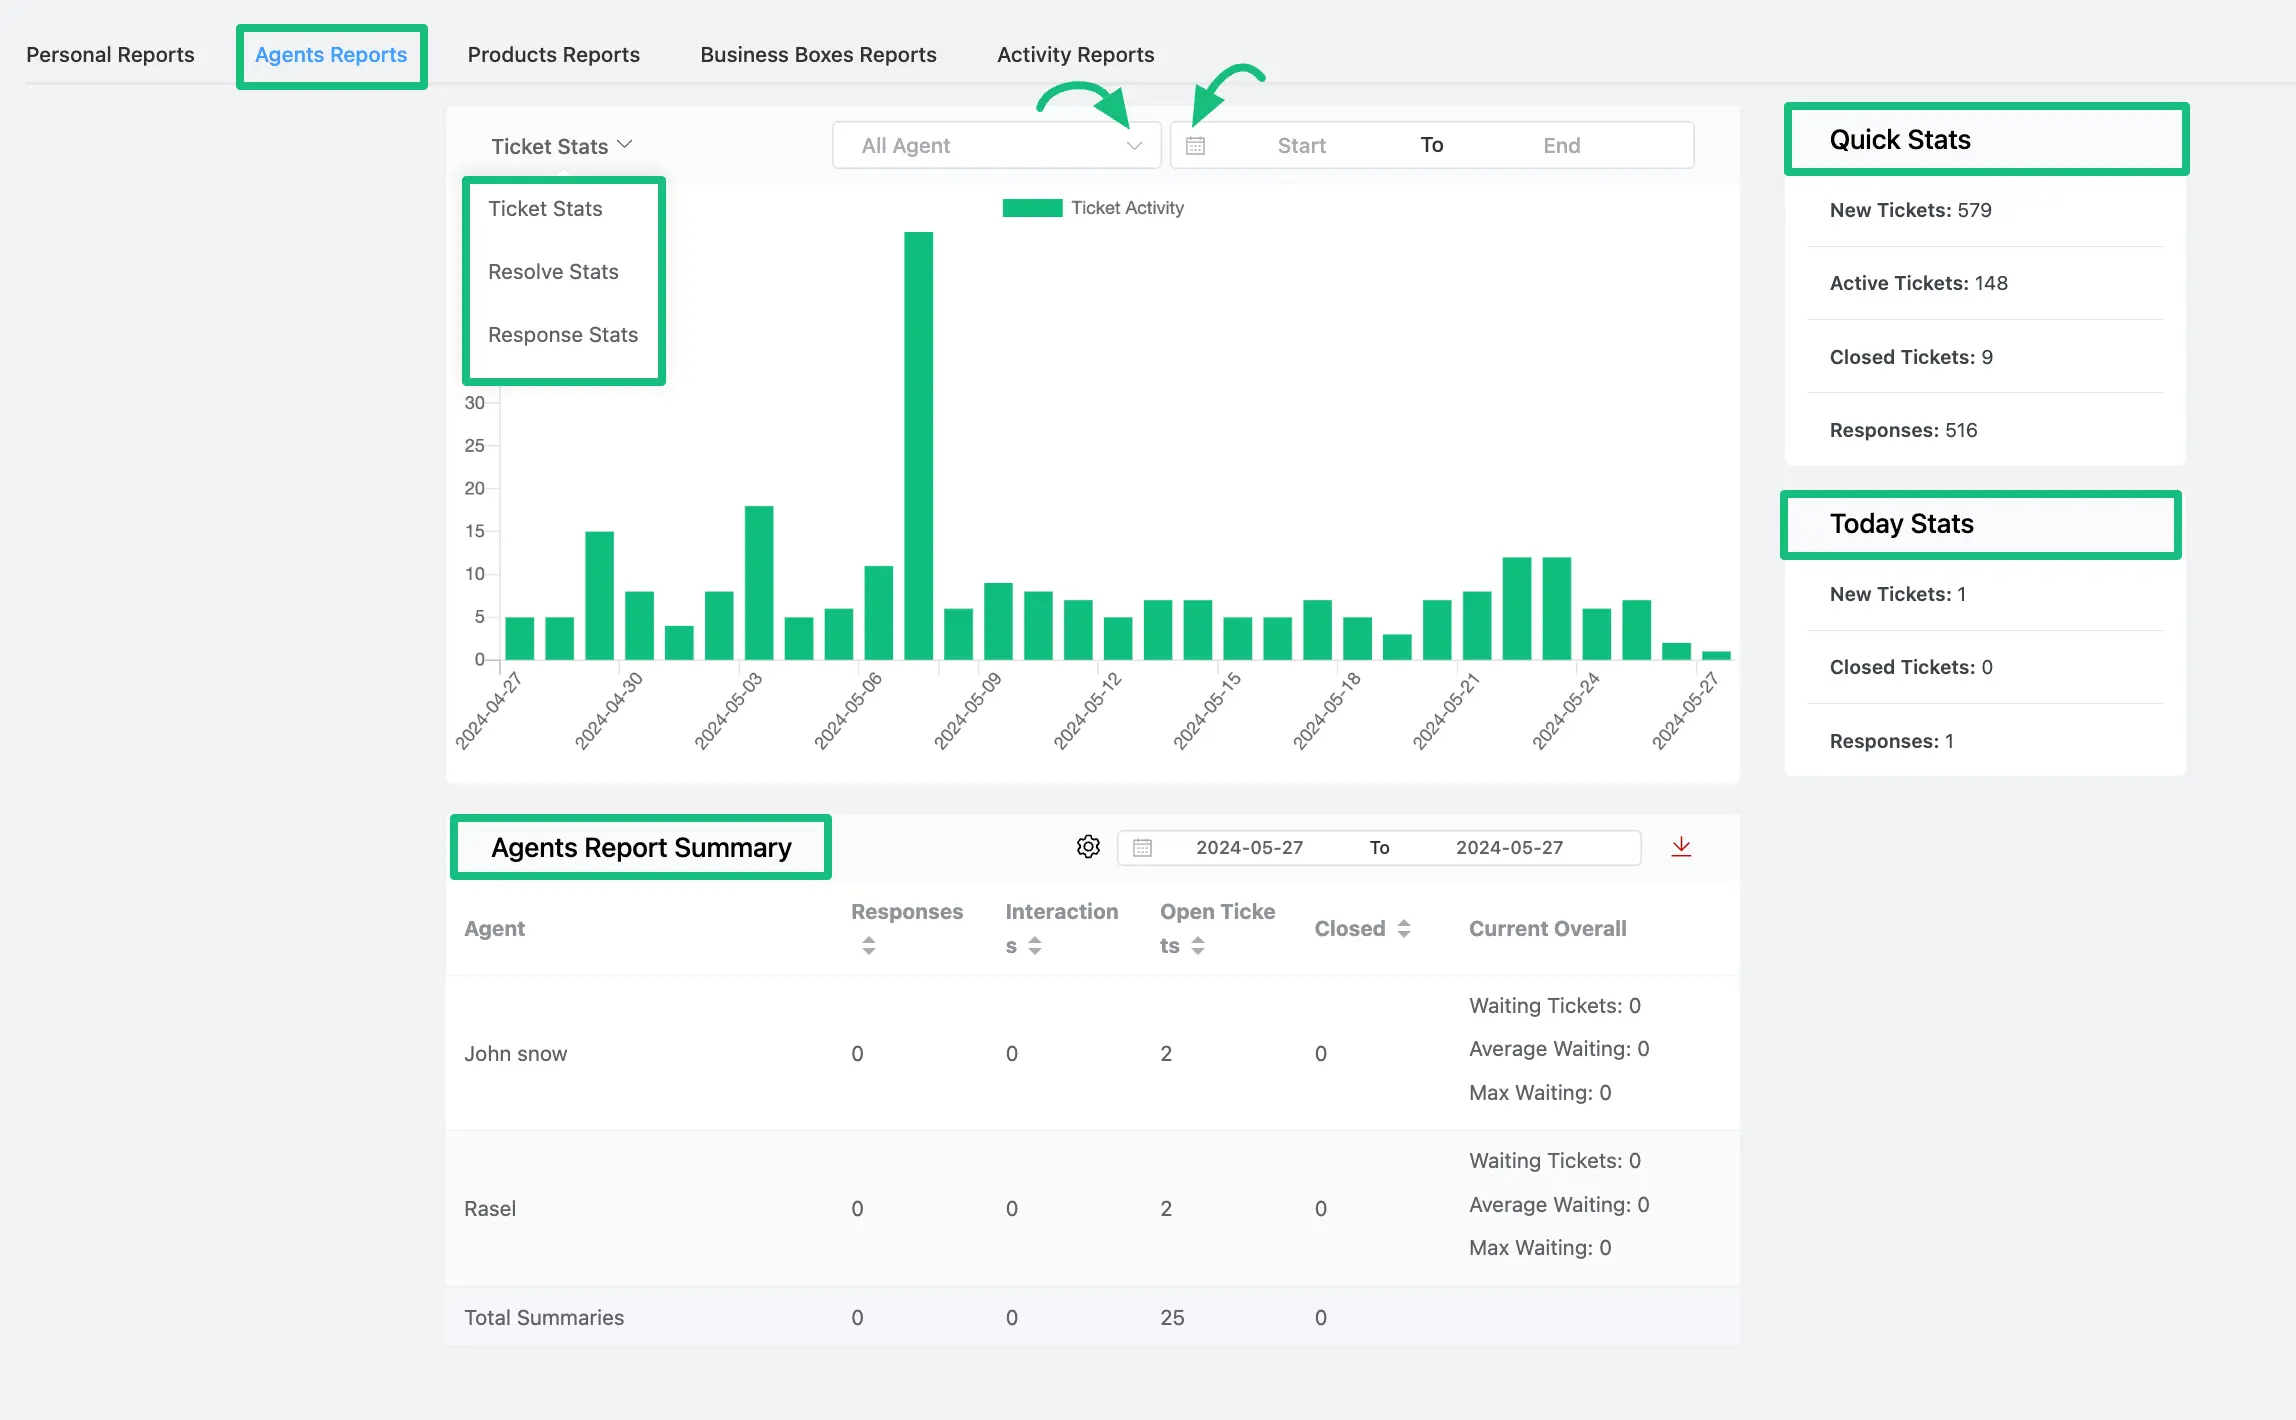
Agents Report Summary #
At the bottom, you will find a summary of each agent’s performance. Also, you can utilize the Date filter to view statistics for a specific period here as well.
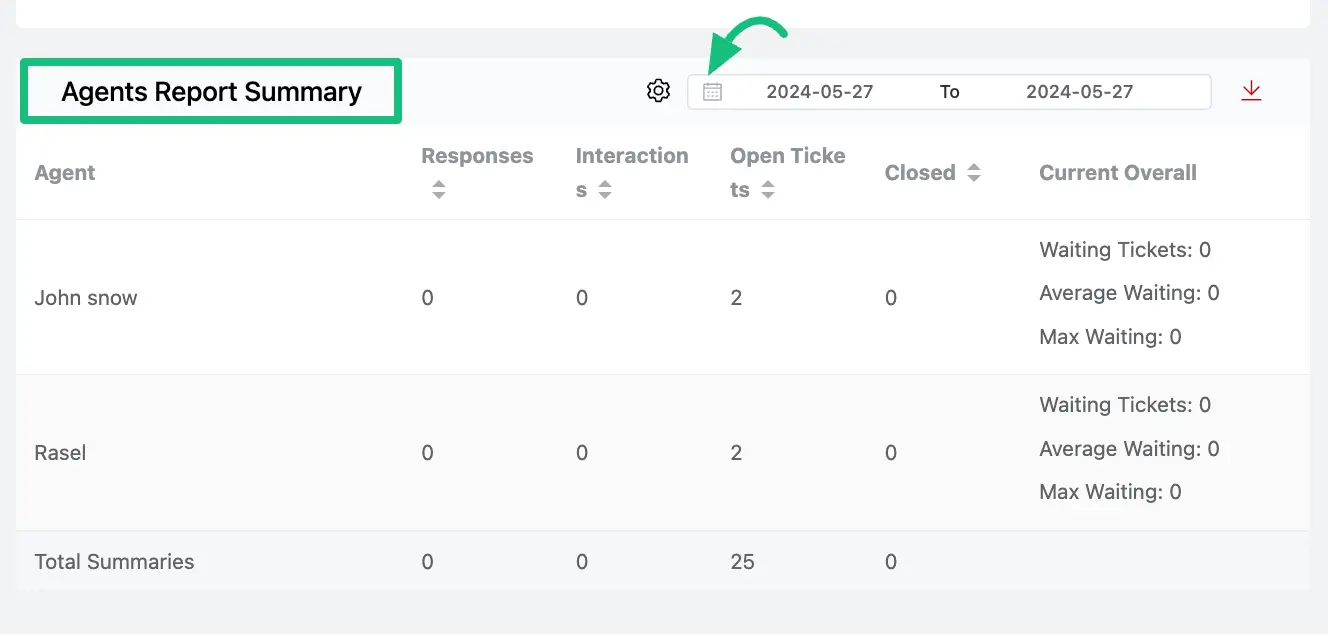
There, you will find the Settings options as well. Use this to select the agent/agents whose summary report/s you want to display.
%20DRIFT-VIDEO-3914819-4019373-1709013601.gif?raw=true)
To Export your data, can download the agents’ summary reports by clicking on the Download Icon located at the right corner of the Agents Reports Summary tab.
You will have the option to choose specific data for export. If no column is selected, all data will be exported.
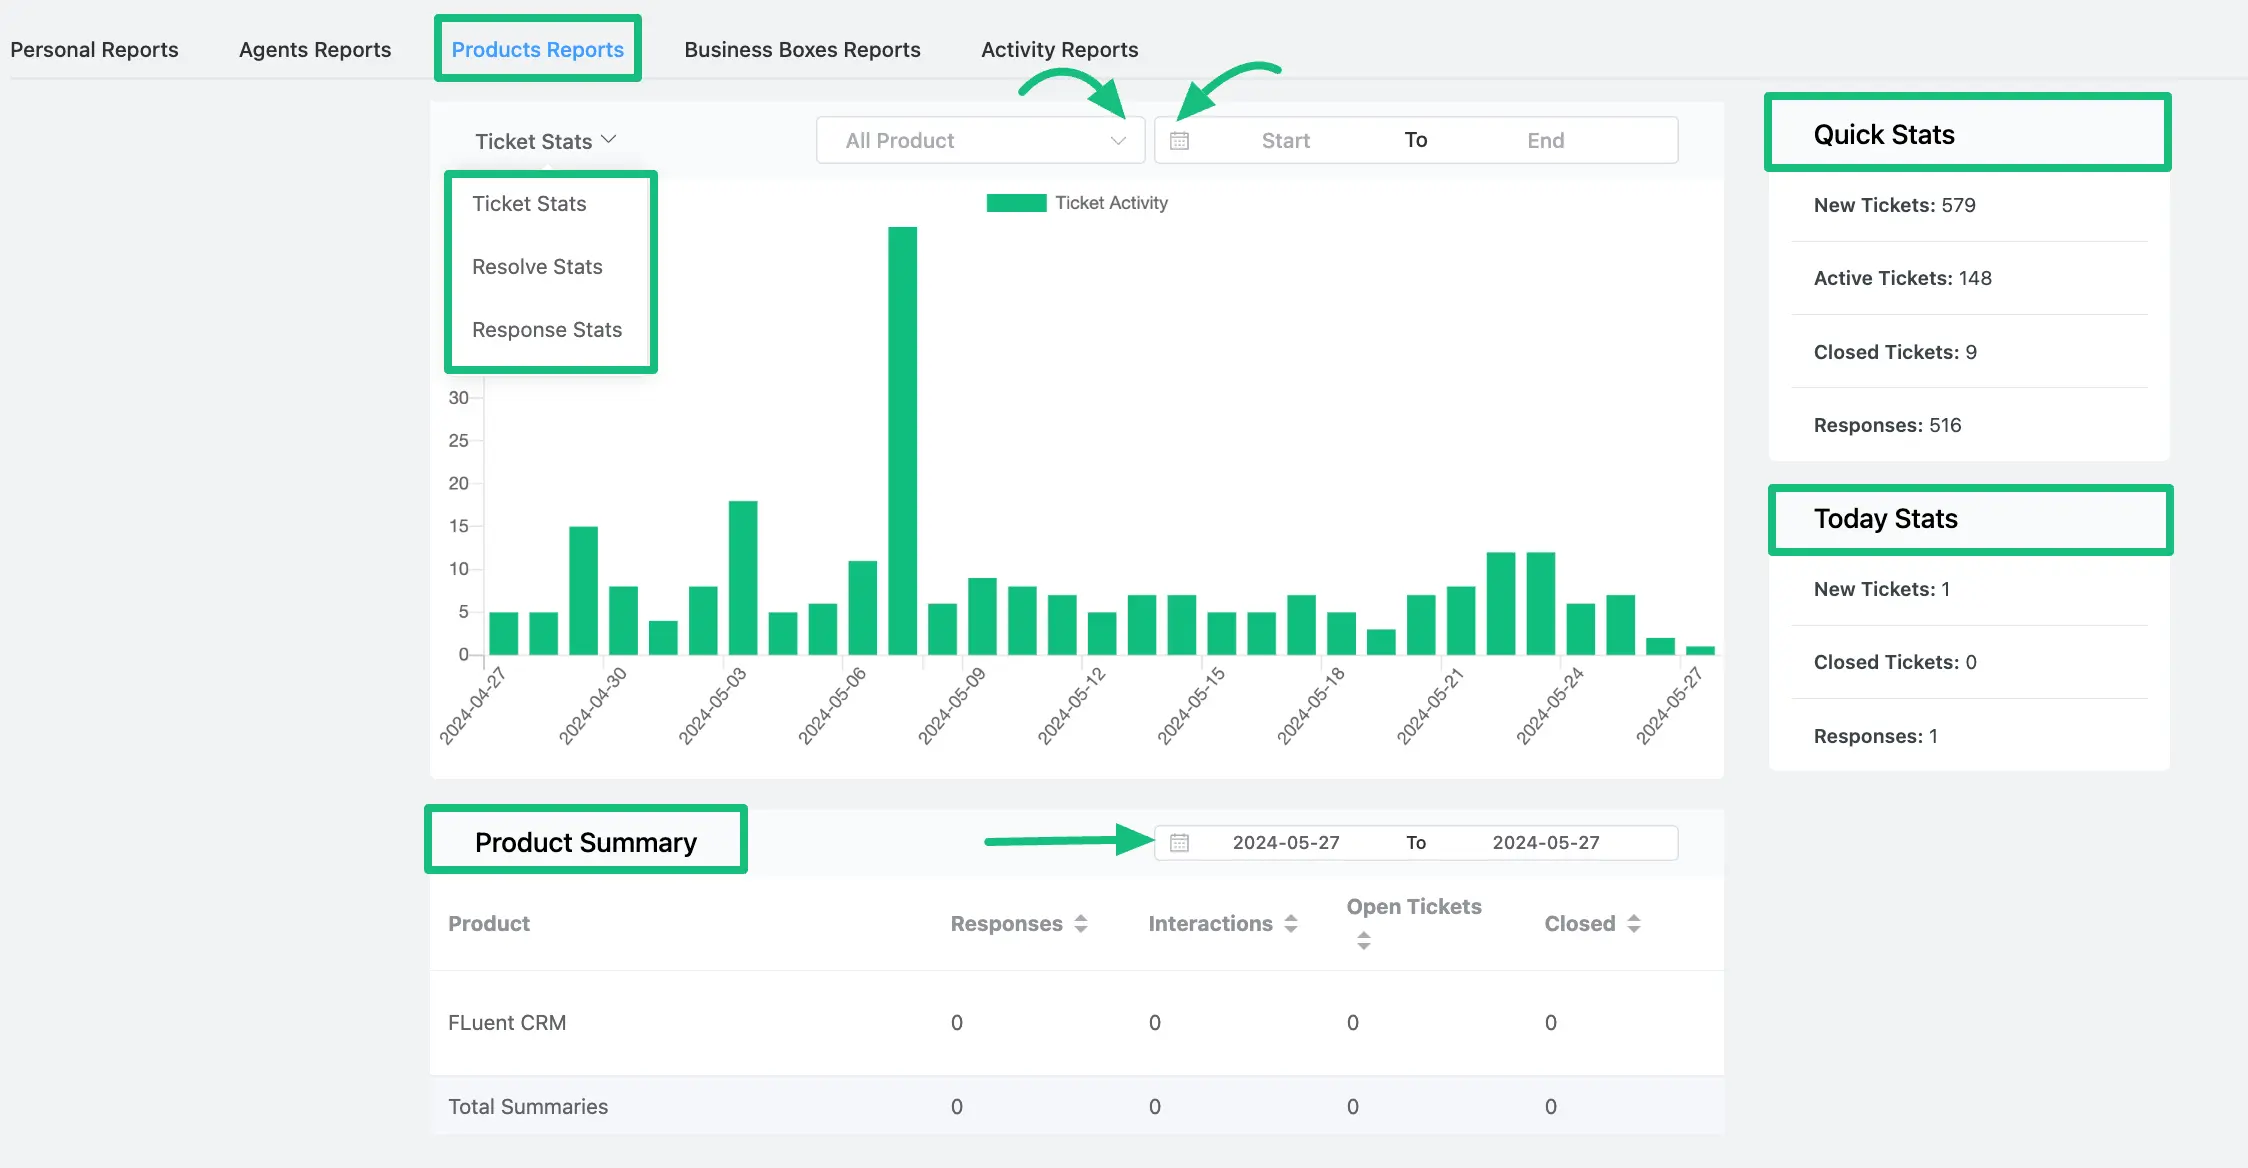
Product Reports #
The ’Product Reports’ section shows the overall report of all the ticket statistics and summaries based on products.
- In this section, you can review Ticket Stats, Resolve Stats, and Response Stats
- You can use the All Product filter to select specific product ticket statistics you want to display
- Also, you can utilize the Date filter to view ticket statistics for a specific period
- On the right side, you’ll see a Quick Stats report that displays the total ticket statistics for the Support Agent, and a Today Stats report that presents the overall ticket statistics for the current day.
- The Product Summary section offers individual ticket reports for each product.
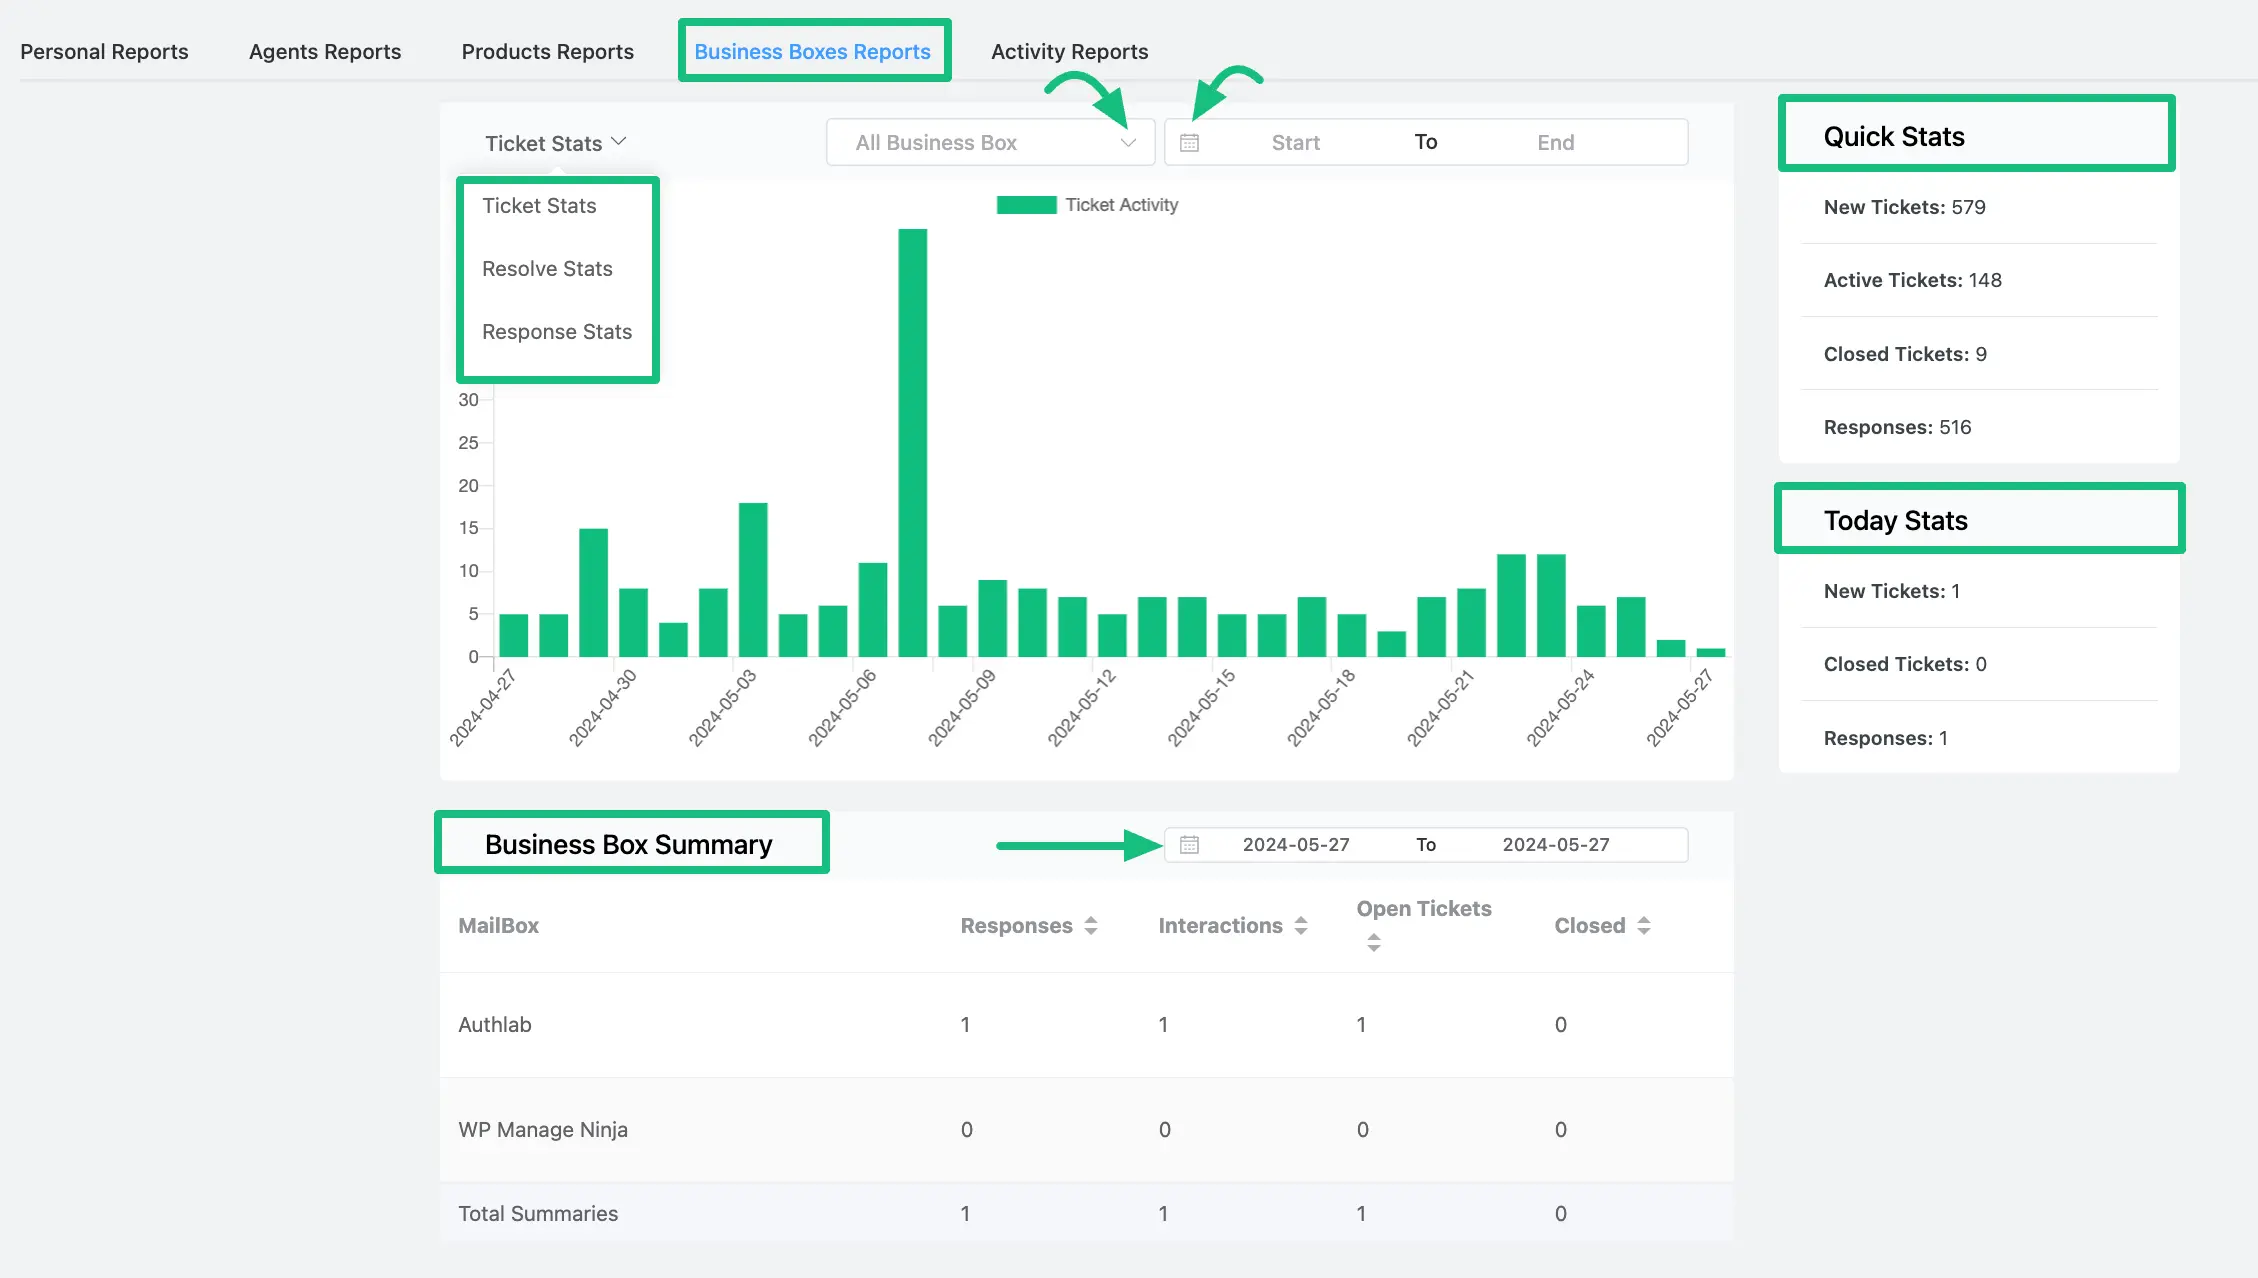
Business Boxes Reports #
The ‘Business Boxes Reports’ section shows the overall report of all the ticket statistics and summaries based on Business Boxes’ tickets.
- In this section, you can review Ticket Stats, Resolve Stats, and Response Stats
- You can use the All Business Box filter to select the desired business box statistics you want to view
- Additionally, you can utilize the Date filter to view ticket statistics for a specific period.
- On the right side, you’ll see a Quick Stats report that displays the total ticket statistics for the Support Agent, and a Today Stats report that presents the overall ticket statistics for the current day.
- The Business Box Summary section offers detailed reports for each business mailbox
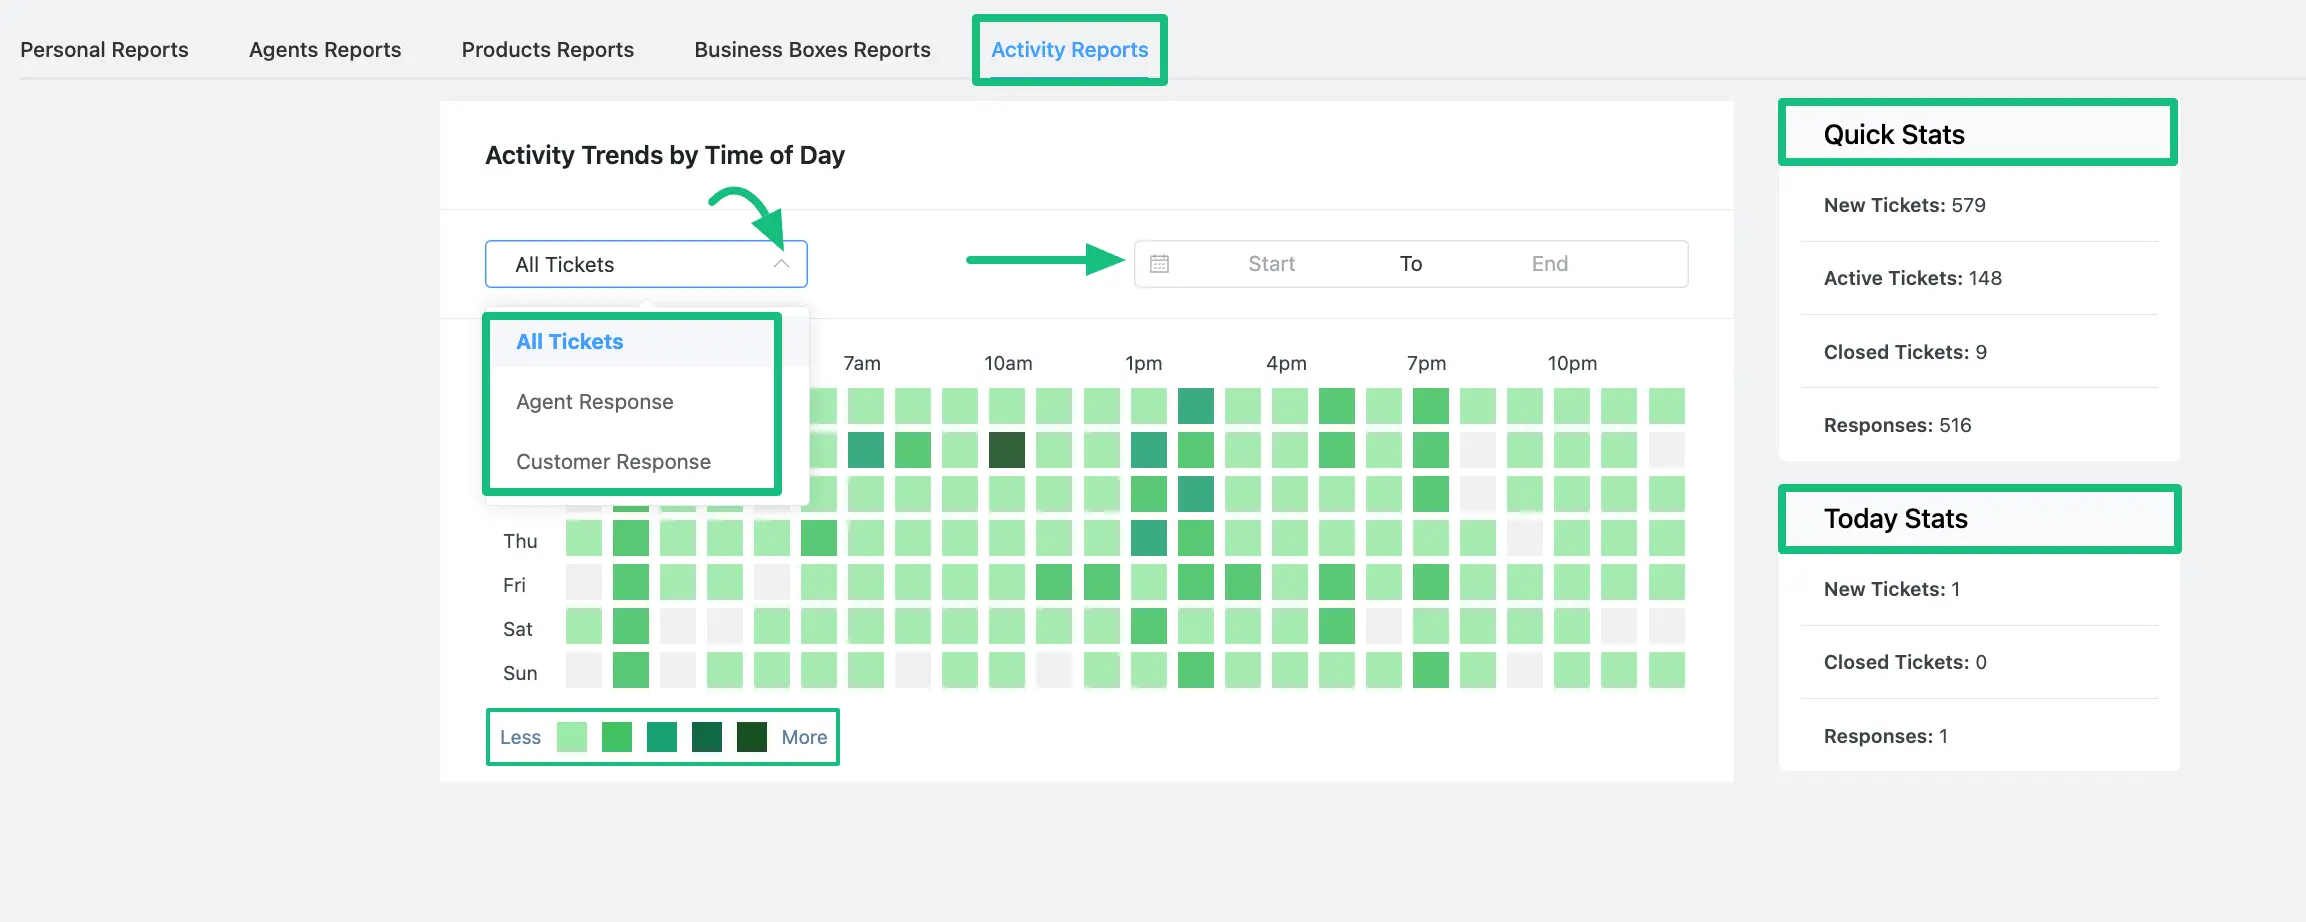
Activity Reports #
The ‘Activity Reports’ section shows the overall report of all the ticket statistics and summaries using a calendar graph based on customers’ and agents’ activities.
- In this section, you can review All Tickets, Agent Response, and Customer Response Stats
- You can utilize the Date filter to view ticket activity trends statistics for a specific period.
- Here, fewer activities are represented by light colors, while more activities are represented by dark colors.
- On the right side, you’ll see a Quick Stats report that displays the total ticket activity statistics for the Support Agents or Customers based on what stats you chose to see, and a Today Stats report that presents the overall ticket statistics for the current day.
- Additionally, inside Agent Response options, you can use the All Agent filter to select the individual agent’s statistics you want to view
If you have any further questions, concerns, or suggestions, please do not hesitate to contact our @support team. Thank you.


